GEN 3.5 Meteorological Services
1.. Meteorological Authority
- The meteorological authority for the United States is the Federal Aviation Administration Assistant Administrator for the Next Generation Air Transportation System (NextGen).
Postal Address:
Assistant Administrator, NextGen
Federal Aviation Administration
Orville Wright Building (FOB-10A)
FAA National Headquarters
800 Independence Avenue, SW.
Washington DC 20591Telephone:202-267-7111
Fax:202-267-5456
- Meteorological Information Service Provider
- The meteorological services for civil aviation are prepared by the National Oceanic and Atmospheric Administration (NOAA) of the U.S. Department of Commerce.
Postal Address:
National Weather Service
National Oceanic and Atmospheric Administration
Department of Commerce
1325 East West Highway
Silver Spring, Maryland 20910
Telephone:301-713-1726
Fax:301-713-1598
- The meteorological services for civil aviation are prepared by the National Oceanic and Atmospheric Administration (NOAA) of the U.S. Department of Commerce.
- Meteorological Offices
- FAA Flight Service Stations
- A complete listing of FAA Flight Service Stations and their telephone numbers is contained in the Chart Supplement U.S. Additionally, communications data and en route services provided by FAA Flight Service Stations are contained in the same publication. Similar information for the Pacific and Alaskan areas is contained in the Chart Supplements Pacific and Alaska. (See GEN 3.2, Aeronautical Charts.)
- FAA Flight Service Stations
- Climatological Summaries
- Requests for copies of climatological summaries are made available through the:
Postal Address:
National Climatic Data Center
Department of Commerce
National Oceanic and Atmospheric Administration
Environmental Data Services Branch
Federal Building
Asheville, North Carolina 28801
- Requests for copies of climatological summaries are made available through the:
2.. Area of Responsibility
- The National Weather Service (NWS) is responsible for providing meteorological services for the 50 states of the U.S., its external territories, and possessions.
- International Flight Documentation Sites. Airports listed below are designated as international flight documentation sites.
TBL GEN 3.5-1 Location
Airport Name
Indicator
Anchorage, AK
Anchorage International
PANC
Atlanta, GA
William B. Hartsfield International
KATL
Baltimore, MD
Baltimore-Washington International
KBWI
Boston, MA
General Edward Lawrence Logan International
KBOS
Charlotte, NC
Charlotte/Douglas International
KCLT
Chicago, IL
O'Hare International
KORD
Cincinnati, OH
Cincinnati/Northern Kentucky International
KCVG
Dallas-Ft. Worth, TX
Dallas-Ft. Worth International
KDFW
Detroit, MI
Detroit Metropolitan Wayne County
KDTW
Fairbanks, AK
Fairbanks International
PAFA
Guam
Guam/Agana Naval Air Station
NOCD AGANA
Hartford, CT
Bradley International
KBDL
Houston, TX
George Bush Intercontinental/Houston
KIAH
Kahului, HI
Kahului
PHOG
Las Vegas, NV
Harry Reid International
KLAS
Los Angeles, CA
Los Angeles International
KLAX
Miami, FL
Miami International
KMIA
Minneapolis, MN
Minneapolis-St. Paul International (Wold-Chamberlain)
KMSP
New Orleans, LA
New Orleans International (Moisant Field)
KMSY
New York, NY
John F. Kennedy International
KJFK
Newark, NJ
Newark International
KEWR
Orlando, FL
Orlando International
KMCO
Pago Pago, American Samoa
Pago Pago International
NSTU
Philadelphia, PA
Philadelphia International
KPHL
Pittsburgh, PA
Pittsburgh International
KPIT
Portland, OR
Portland International
KPDX
Raleigh-Durham, NC
Raleigh-Durham International
KRDU
San Francisco, CA
San Francisco International
KSFO
San Juan, PR
Luis Munoz Marin International
TJSJ
Seattle, WA
Seattle-Tacoma International
KSEA
Tampa, FL
Tampa International
KTPA
Washington, DC
Washington Dulles International
KIAD
- Climatological information, basically in the form of climatological summaries, is available at all designated international airports in the U.S.
- Flight documentation is provided in the form of copies of facsimile charts, copies of teletype-writer forecasts, and airport forecast decode sheets. Flight documentation materials are available at all destination regular airport meteorological stations. English is the language used for all U.S. flight documentation. Briefings can be provided either in person or received by telephone at all airport meteorological offices.
- All airport forecasts (TAF) prepared for U.S. international airports cover the following validity periods: 00-24 UTC, 06-06 UTC, 12-12 UTC, and 18-18 UTC. At the present time, specific landing forecasts are not made for any U.S. airport. The portion of the airport's TAF valid closest to the time of landing is used in lieu of a landing forecast.
- Supplementary information available at U.S. meteorological airport offices includes extended weather and severe weather outlooks, pilot reports, runway braking action reports (during the winter), relative humidity, times of sunrise and sunset, surface and upper air analyses, radar echo charts, and forecasts of maximum and minimum surface temperatures.
- All meteorological offices shown as taking routine aviation observations also take unscheduled special aviation observations when meteorological conditions warrant.
3.. Types of Service Provided
- Area Forecast Charts (Facsimile Form)
- The U.S. has one Area Forecast Center, the National Center for Environmental Predictions (NCEP), located in Suitland, Maryland. The NCEP prepares current weather, significant weather, forecast weather, constant pressure, and tropopause-vertical wind shear charts for the U.S., the Caribbean and Northern South America, the North Atlantic, and the North Pacific areas. The NCEP also prepares a constant pressure and tropopause-vertical wind shear chart for Canada.
- Local and Regional Aviation Forecasts (Printed Form)
- Numerous forecasts and weather advisories are prepared which serve local and regional areas of the U.S. These forecasts are generally prepared by the NWS on a scheduled basis or, as in the case of severe weather advisories, as needed. These forecasts are Area Forecast (FA), Airport Forecast (TAF), Severe Weather Forecast (WW), Hurricane Advisories (WT), Winds and Temperature Aloft Forecast (FD), Simplified Surface Analyses (AS), 12- and 24-Hour Prognoses (FS), and flight advisory notices, such as SIGMETs (WS), AIRMETs (text bulletins-[WA] and graphics [G-AIRMET]), Center Weather Advisories (CWA), and Radar Weather Reports (SD).
- Preflight Briefing Services
- Preflight briefing services and flight documentation are provided through FAA Flight Service Stations (FSS).
- National Weather Service Aviation Weather Service Program
- Weather service to aviation is a joint effort of the National Oceanic and Atmospheric Administration (NOAA), the National Weather Service (NWS), the Federal Aviation Administration (FAA), Department of Defense, and various private sector aviation weather service providers. Requirements for all aviation weather products originate from the FAA, which is the Meteorological Authority for the U.S.
- NWS meteorologists are assigned to all air route traffic control centers (ARTCC) as part of the Center Weather Service Units (CWSU) as well as the Air Traffic Control System Command Center (ATCSCC). These meteorologists provide specialized briefings as well as tailored forecasts to support the needs of the FAA and other users of the NAS.
- Aviation Products
- The NWS maintains an extensive surface, upper air, and radar weather observing program; and a nationwide aviation weather forecasting service.
- Airport observations (METAR and SPECI) supported by the NWS are provided by automated observing systems.
- Terminal Aerodrome Forecasts (TAF) are prepared by 123 NWS Weather Forecast Offices (WFOs) for over 700 airports. These forecasts are valid for 24 or 30 hours and amended as required.
- Inflight aviation advisories (for example, Significant Meteorological Information (SIGMETs) and Airmen's Meteorological Information (AIRMETs)) are issued by three NWS Meteorological Watch Offices (MWOs); the Aviation Weather Center (AWC) in Kansas City, MO, the Alaska Aviation Weather Unit (AAWU) in Anchorage, AK, and the Weather Service Forecast Office (WFO) in Honolulu, HI. The AWC, the AAWU, and WSFO Honolulu issue area forecasts for selected areas. In addition, NWS meteorologists assigned to most ARTCCs as part of the Center Weather Service Unit (CWSU) provide Center Weather Advisories (CWAs) and gather weather information to support the needs of the FAA and other users of the system.
- Several NWS National Centers for Environmental Production (NCEP) provide aviation specific weather forecasts, or select public forecasts which are of interest to pilots and operators.
- The Aviation Weather Center (AWC) displays a variety of domestic and international aviation forecast products over the Internet at aviationweather.gov.
- The NCEP Central Operations (NCO) is responsible for the operation of many numerical weather prediction models, including those which produce the many wind and temperature aloft forecasts.
- The Storm Prediction Center (SPC) issues tornado and severe weather watches along with other guidance forecasts.
- The National Hurricane Center (NHC) issues forecasts on tropical weather systems (for example, hurricanes).
- The Space Weather Prediction Center (SWPC) provides alerts, watches, warnings and forecasts for space weather events (for example, solar storms) affecting or expected to affect Earth's environment.
- The Weather Prediction Center (WPC) provides analysis and forecast products on a national scale including surface pressure and frontal analyses.
- NOAA operates two Volcanic Ash Advisory Centers (VAAC) which issue forecasts of ash clouds following a volcanic eruption in their area of responsibility.
- Details on the products provided by the above listed offices and centers is available in FAA-H-8083-28, Aviation Weather Handbook.
- Weather element values may be expressed by using different measurement systems depending on several factors, such as whether the weather products will be used by the general public, aviation interests, international services, or a combination of these users. FIG GEN 3.5-1 provides conversion tables for the most used weather elements that will be encountered by pilots.
FIG GEN 3.5-1Weather Elements Conversion Tables 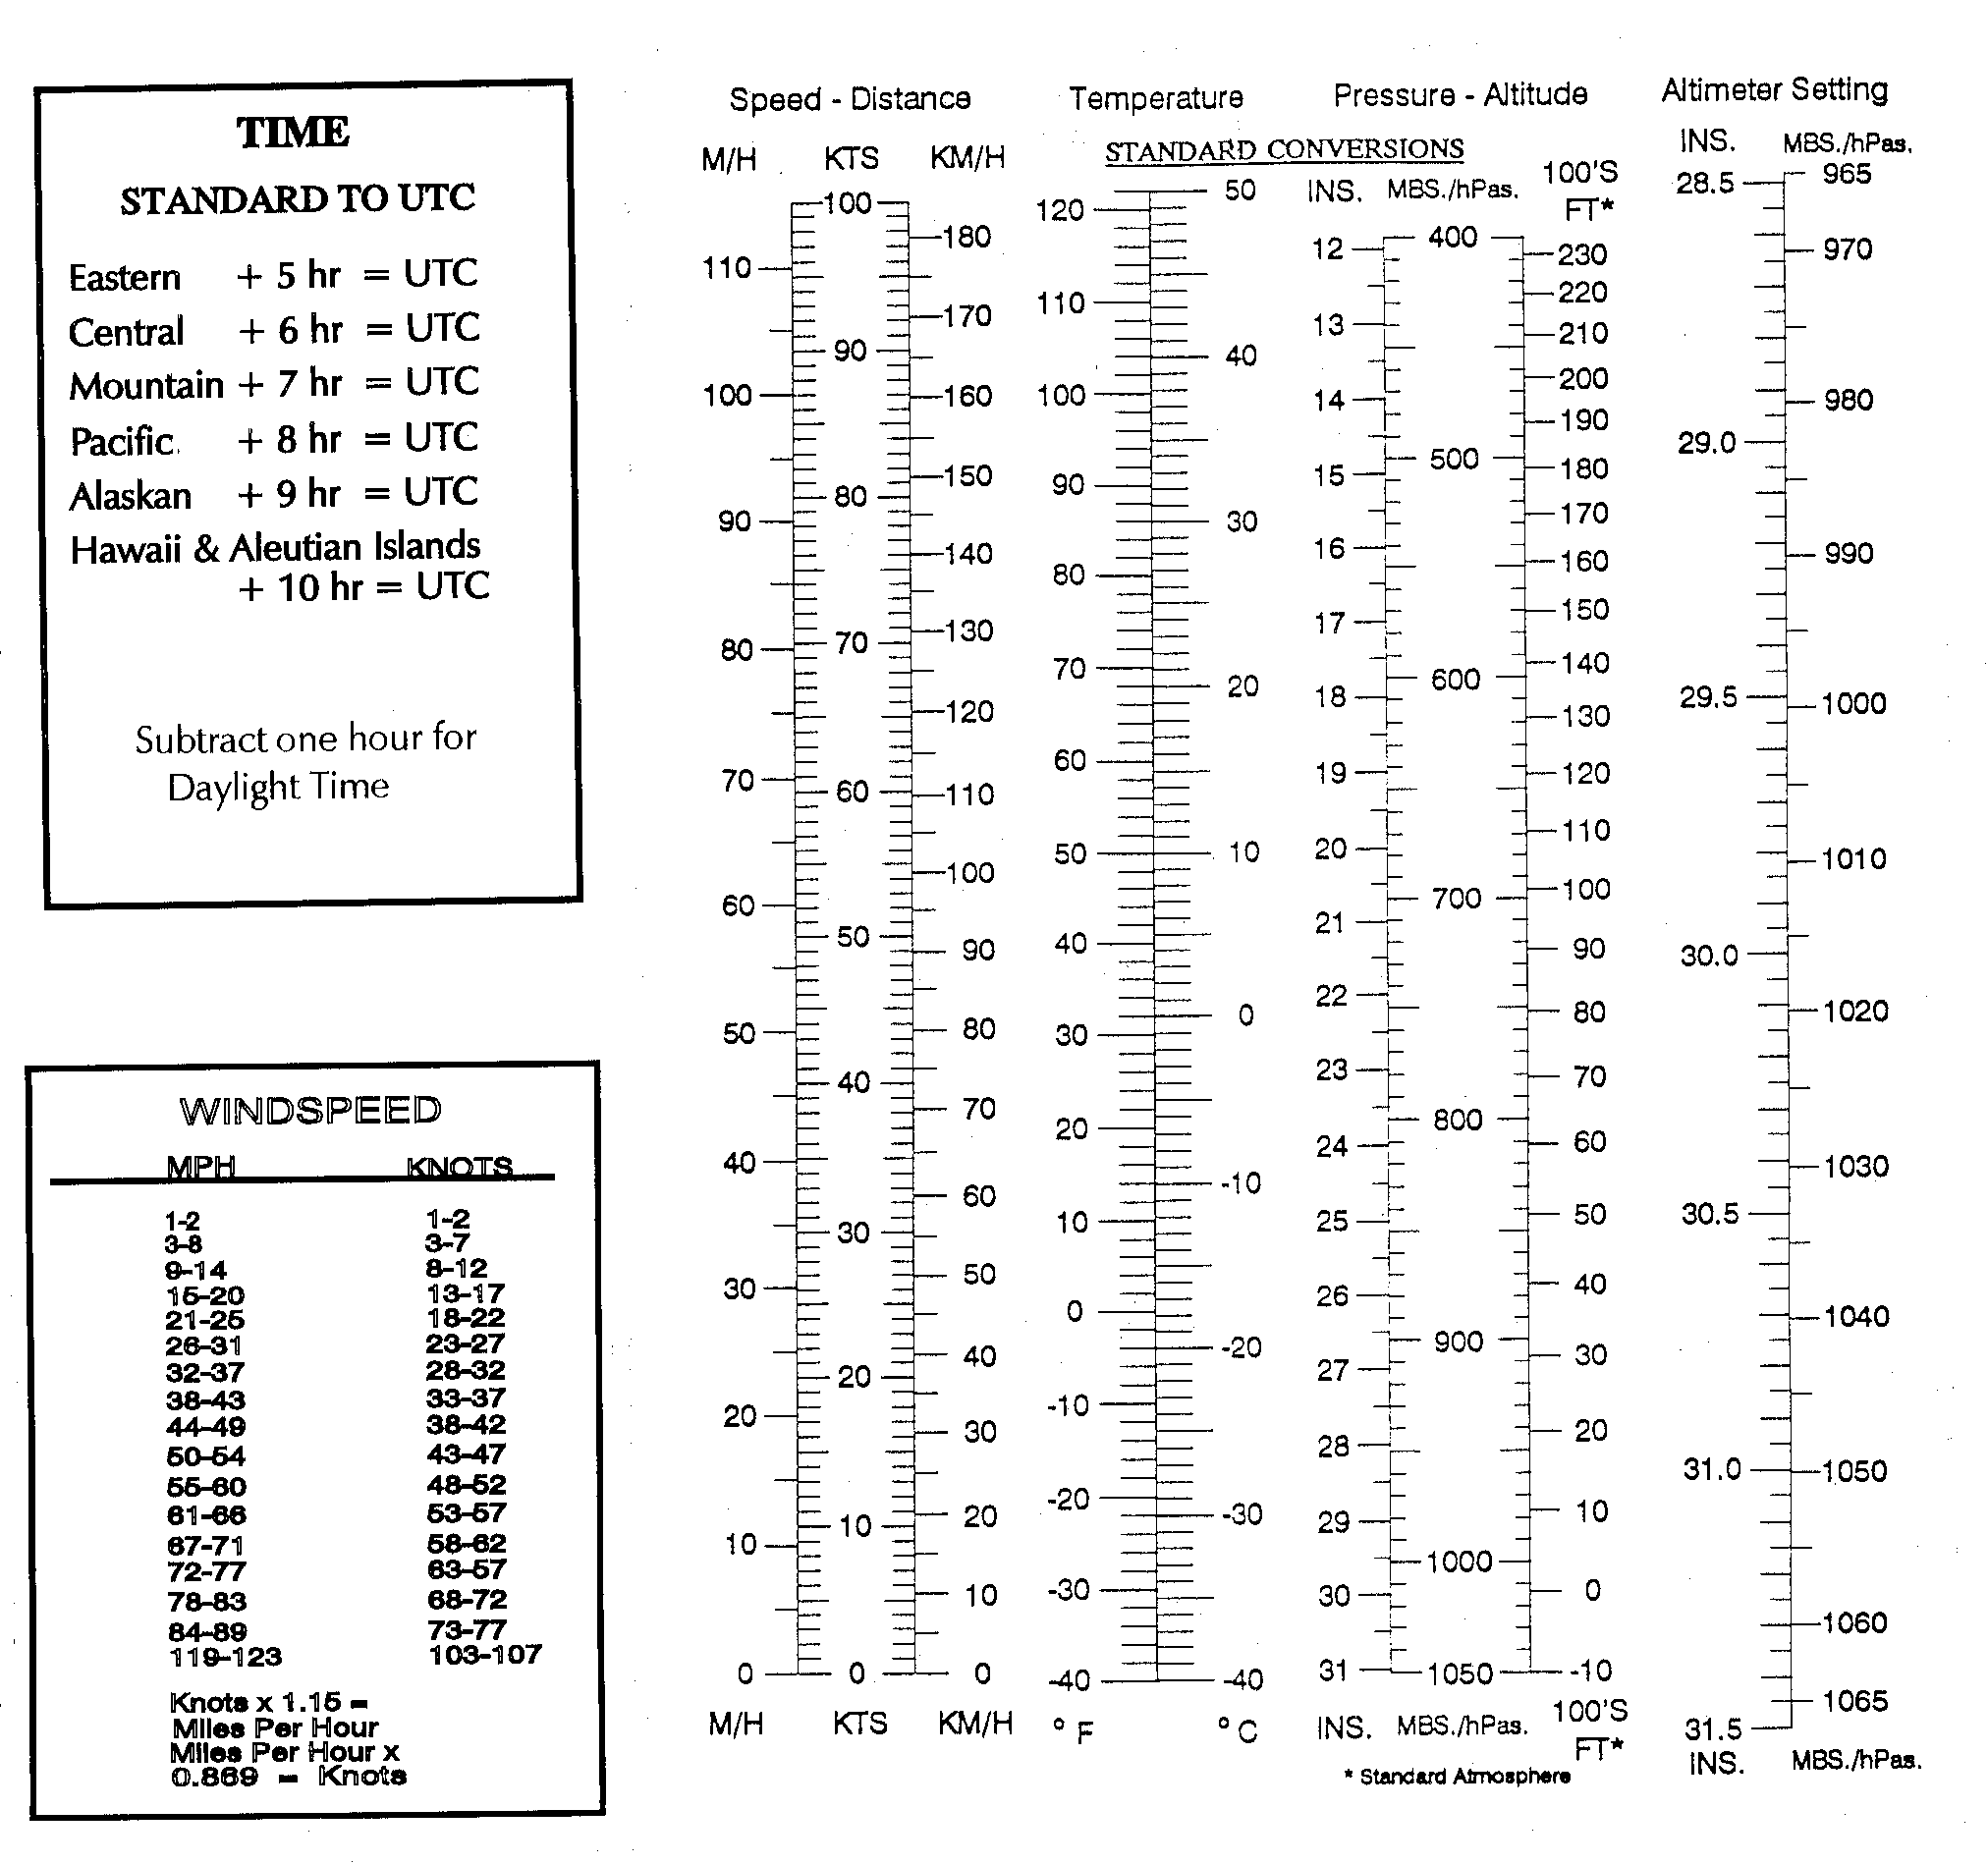
- FAA Weather Services
- The FAA provides the Flight Service program, which serves the weather needs of pilots through its flight service stations (FSS). Pilots may access weather information through www.1800wxbrief.com. To contact Flight Service in the CONUS, Hawaii, and U.S. territories, call 1-800-WX-BRIEF (1-800-992-7433); in Alaska call 1-833-AK-BRIEF (1-833-252-7433).
- The FAA maintains an extensive surface weather observing program. Airport observations (METAR and SPECI) in the U.S. are provided by automated observing systems. Various levels of human oversight of the METAR and SPECI reports and augmentation may be provided at select larger airports by either government or contract personnel qualified to report specified weather elements that cannot be detected by the automated observing system. The requirements to issue SPECI reports are detailed in TBL GEN 3.5-2.
TBL GEN 3.5-2 SPECI Issuance Table
1
Wind Shift
Wind direction changes by 45° or more, in less than 15 minutes, and the wind speed is 10 kt or more throughout the wind shift.
2
Visibility
The surface visibility (as reported in the body of the report):S Decreases to less than 3 sm, 2 sm, 1 sm, ½ sm, ¼ sm or the lowest standard instrument approach procedure (IAP) minimum.1S Increases to equal to or exceed 3 sm, 2 sm, 1 sm, ½ sm, ¼ sm or the lowest standard IAP minimum.11 As published in the U.S. Terminal Procedures. If none published, use ½ sm.
3
RVR
The highest value from the designated RVR runway decreases to less than 2,400 ft during the preceding 10 minutes; or, if the RVR is below 2,400 ft, increases to equal to or exceed 2,400 ft during the preceding 10minutes. U.S. military stations may not report a SPECI based on RVR.
4
Tornado, Funnel Cloud, or
WaterspoutS Is observed.S Disappears from sight or ends.
5
Thunderstorm
S Begins (a SPECI is not required to report the beginning of a new thunderstorm if one is currently reported).S Ends.
6
Precipitation
S Hail begins or ends.S Freezing precipitation begins, ends, or changes intensity.S Ice pellets begin, end, or change intensity.S Snow begins, ends, or changes intensity.
7
Squalls
When a squall occurs. (Wind speed suddenly increases by at least 16 knots and is sustained at 22 knots or more for at least one minute.)
8
Ceiling
The ceiling changes1 through:S 3,000 ft.S 1,500 ft.S 1,000 ft.S 500 ft.S The lowest standard IAP minimum.21 “Ceiling change” means that it forms, dissipates below, decreases to less than, or, if below, increases to equal or exceed the values listed.2 As published in the U.S. Terminal Procedures. If none published, use 200 ft.
9
Sky Condition
A layer of clouds or obscurations aloft is present below 1,000 ft and no layer aloft was reported below 1,000 ft in the preceding METAR or SPECI.
10
Volcanic Eruption
When an eruption is first noted.
11
Aircraft Mishap
Upon notification of an aircraft mishap,1 unless there has been an intervening observation.1 “Aircraft mishap” is an inclusive term to denote the occurrence of an aircraft accident or incident.
12
Miscellaneous
Any other meteorological situation designated by the responsible agency of which, in the opinion of the observer, is critical.
- Other Sources of Weather Information
- Weather and aeronautical information are available from numerous private industry sources on an individual or contract pay basis.Prior to every flight, pilots should gather all information vital to the nature of the flight. Pilots can receive a regulatory compliant briefing without contacting Flight Service. Pilots are encouraged to use automated resources and review AC 91-92, Pilot's Guide to a Preflight Briefing, for more information.
- Pilots can access Leidos Flight Services via the Internet at http://www.1800wxbrief.com. Pilots can receive preflight weather data and file VFR and IFR flight plans.
- Use of Aviation Weather Products
- Air carriers and operators certificated under the provisions of 14 CFR Part 119 are required to use the aeronautical weather information systems defined in the Operations Specifications issued to that certificate holder by the FAA. These systems may utilize basic FAA/National Weather Service (NWS) weather services, contractor- or operator-proprietary weather services and/or Enhanced Weather Information System (EWINS) when approved in the Operations Specifications. As an integral part of this system approval, the procedures for collecting, producing and disseminating aeronautical weather information, as well as the crew member and dispatcher training to support the use of system weather products, must be accepted or approved.
- Operators not certificated under the provisions of 14 CFR Part 119 are encouraged to use FAA/NWS products through Flight Service Stations, Leidos Flight Service, and/or Flight Information Services-Broadcast (FIS-B).
- The suite of available aviation weather product types is expanding, with the development of new sensor systems, algorithms and forecast models. The FAA and NWS, supported by various weather research laboratories and corporations under contract to the Government, develop and implement new aviation weather product types. The FAA's NextGen Aviation Weather Research Program (AWRP) facilitates collaboration between the NWS, the FAA, and various industry and research representatives. This collaboration ensures that user needs and technical readiness requirements are met before experimental products mature to operational application.
- The AWRP manages the transfer of aviation weather R&D to operational use through technical review panels and conducting safety assessments to ensure that newly developed aviation weather products meet regulatory requirements and enhance safety.
- The AWRP review and decision-making process applies criteria to weather products at various stages . The stages are composed of the following:
- Sponsorship of user needs.
- R & D and controlled testing.
- Experimental application.
- Operational application.
- Pilots and operators should be aware that weather services provided by entities other than FAA, NWS, or their contractors may not meet FAA/NWS quality control standards. Hence, operators and pilots contemplating using such services should request and/or review an appropriate description of services and provider disclosure. This should include, but is not limited to, the type of weather product (for example, current weather or forecast weather), the currency of the product (that is, product issue and valid times), and the relevance of the product. Pilots and operators should be cautious when using unfamiliar products, or products not supported by FAA/NWS technical specifications.
- In addition, pilots and operators should be aware there are weather services and products available from government organizations beyond the scope of the AWRP process mentioned earlier in this section. For example, governmental agencies such as the NWS and the Aviation Weather Center (AWC), or research organizations such as the National Center for Atmospheric Research (NCAR) display weather “model data” and “experimental” products which require training and/or expertise to properly interpret and use. These products are developmental prototypes that are subject to ongoing research and can change without notice. Therefore, some data on display by government organizations, or government data on display by independent organizations may be unsuitable for flight planning purposes. Operators and pilots contemplating using such services should request and/or review an appropriate description of services and provider disclosure. This should include, but is not limited to, the type of weather product (for example, current weather or forecast weather), the currency of the product (i.e., product issue and valid times), and the relevance of the product. Pilots and operators should be cautious when using unfamiliar weather products.
- With increased access to weather products via the public Internet, the aviation community has access to an overwhelming amount of weather information and data that support self-briefing. The FAA Aviation Weather Handbook, FAA-H-8083-28 (current edition), describes the weather products distributed by the NWS. Pilots and operators using the public Internet to access weather from a third party vendor should request and/or review an appropriate description of services and provider disclosure. This should include, but is not limited to, the type of weather product (for example, current weather or forecast weather), the currency of the product (i.e., product issue and valid times), and the relevance of the product. Pilots and operators should be cautious when using unfamiliar weather products and when in doubt, consult with a Flight Service Specialist.
- The development of new weather products, coupled with the termination of some legacy textual and graphical products may create confusion between regulatory requirements and the new products. All flight-related, aviation weather decisions must be based on all available pertinent weather products. As every flight is unique and the weather conditions for that flight vary hour by hour, day to day, multiple weather products may be necessary to meet aviation weather regulatory requirements. Many new weather products now have a Precautionary Use Statement that details the proper use or application of the specific product.
- The FAA has identified three distinct types of weather information available to pilots and operators.
- Observations. Raw weather data collected by some type of sensor suite including surface and airborne observations, radar, lightning, satellite imagery, and profilers.
- Analysis. Enhanced depiction and/or interpretation of observed weather data.
- Forecasts. Predictions of the development and/or movement of weather phenomena based on meteorological observations and various mathematical models.
- Not all sources of aviation weather information are able to provide all three types of weather information. The FAA has determined that operators and pilots may utilize the following approved sources of aviation weather information:
- Federal Government. The FAA and NWS collect raw weather data, analyze the observations, and produce forecasts. The FAA and NWS disseminate meteorological observations, analyses, and forecasts through a variety of systems. In addition, the Federal Government is the only approval authority for sources of weather observations; for example, contract towers and airport operators may be approved by the Federal Government to provide weather observations.
- Enhanced Weather Information System (EWINS). An EWINS is an FAA authorized, proprietary system for tracking, evaluating, reporting, and forecasting the presence or lack of adverse weather phenomena. The FAA authorizes a certificate holder to use an EWINS to produce flight movement forecasts, adverse weather phenomena forecasts, and other meteorological advisories. For more detailed information regarding EWINS, see the FAA-H-8083-28, Aviation Weather Handbook, and the Flight Standards Information Management System 8900.1.
- Commercial Weather Information Providers. In general, commercial providers produce proprietary weather products based on NWS/FAA products with formatting and layout modifications but no material changes to the weather information itself. This is also referred to as “repackaging.” In addition, commercial providers may produce analyses, forecasts, and other proprietary weather products that substantially alter the information contained in government-produced products. However, those proprietary weather products that substantially alter government-produced weather products or information, may only be approved for use by 14 CFR Part 121 and Part 135 certificate holders if the commercial provider is EWINS qualified.
- Graphical Forecasts for Aviation (GFA)
- The GFA website is intended to provide the necessary aviation weather information to give users a complete picture of the weather that may affect flight in the continental United States (CONUS). The website includes observational data, forecasts, and warnings that can be viewed from 14 hours in the past to 15 hours in the future, including thunderstorms, clouds, flight category, precipitation, icing, turbulence, and wind. Hourly model data and forecasts, including information on clouds, flight category, precipitation, icing, turbulence, wind, and graphical output from the National Weather Service's (NWS) National Digital Forecast Data (NDFD) are available. Wind, icing, and turbulence forecasts are available in 3,000 ft increments from the surface up to 30,000 ft MSL, and in 6,000 ft increments from 30,000 ft MSL to 48,000 ft MSL. Turbulence forecasts are also broken into low (below 18,000 ft MSL) and high (at or above 18,000 ft MSL) graphics. A maximum icing graphic and maximum wind velocity graphic (regardless of altitude) are also available. Built with modern geospatial information tools, users can pan and zoom to focus on areas of greatest interest. Target users are commercial and general aviation pilots, operators, briefers, and dispatchers.
- Weather Products.
- The Aviation Forecasts include gridded displays of various weather parameters as well as NWS textual weather observations, forecasts, and warnings. Icing, turbulence, and wind gridded products are three-dimensional. Other gridded products are two-dimensional and may represent a “composite” of a three-dimensional weather phenomenon or a surface weather variable, such as horizontal visibility. The following are examples of aviation forecasts depicted on the GFA:
- Terminal Aerodrome Forecast (TAF)
- Ceiling & Visibility (CIG/VIS)
- Clouds
- Precipitation / Weather (PCPN/WX)
- Thunderstorm (TS)
- Winds
- Turbulence
- Ice
- Observations & Warnings (Obs/Warn). The Obs/Warn option provides an option to display weather data for the current time and the previous 14 hours (rounded to the nearest hour). Users may advance through time using the arrow buttons or by clicking on the desired hour. Provided below are the Obs/Warn product tabs available on the GFA website:
- METAR
- Precipitation/Weather (PCPN/WX)
- Ceiling & Visibility (CIG/VIS)
- Pilot Weather Report (PIREP)
- Radar & Satellite (RAD/SAT)
- The GFA will be continuously updated and available online at http://aviationweather.gov/gfa. Upon clicking the link above, select INFO on the top right corner of the map display. The next screen presents the option of selecting Overview, Products, and Tutorial. Simply select the tab of interest to explore the enhanced digital and graphical weather products designed to replace the legacy FA. Users should also refer to the Aviation Weather Handbook, FAA-H-8083-28, Graphical Forecasts for Aviation (GFA) Tool, for more detailed information on the GFA.
- GFA Static Images. Some users with limited internet connectivity may access static images via the Aviation Weather Center (AWC) Decision Support Imagery at: https://aviationweather.gov/graphics/ . There are two static graphical images available, titled Aviation Cloud Forecast and Aviation Surface Forecast. The Aviation Cloud Forecast provides cloud coverage, bases, layers, and tops with AIRMETs for mountain obscuration and AIRMETs for icing overlaid. The Aviation Surface Forecast provides visibility, weather phenomena, and winds (including wind gusts) with AIRMETs for instrument flight rules conditions and AIRMETs for sustained surface winds of 30 knots or more overlaid. These images are presented on ten separate maps providing forecast views for the entire contiguous United States (U.S.) on one and nine regional views which provide more detail for the user. They are updated every 3 hours and provide forecast snapshots for 3, 6, 9, 12, 15, and 18 hours into the future. (See FIG GEN 3.5-2 and FIG GEN 3.5-2.)
FIG GEN 3.5-2Aviation Surface Forecast 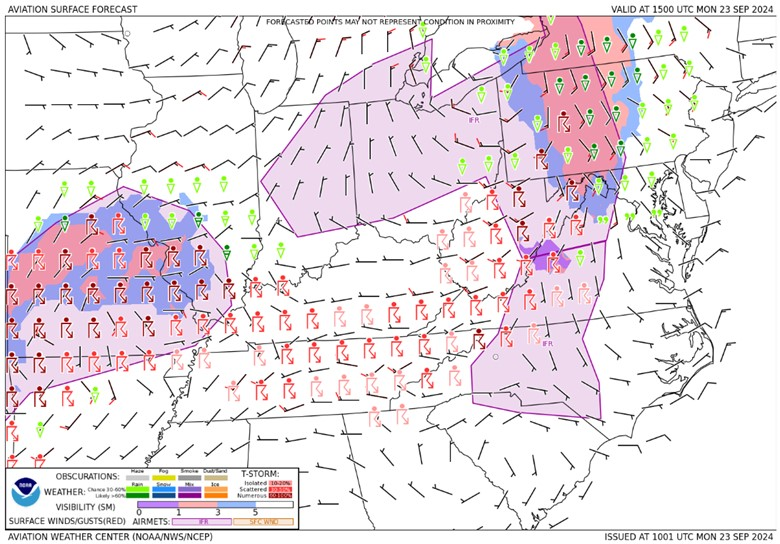
FIG GEN 3.5-3Aviation Cloud Forecast 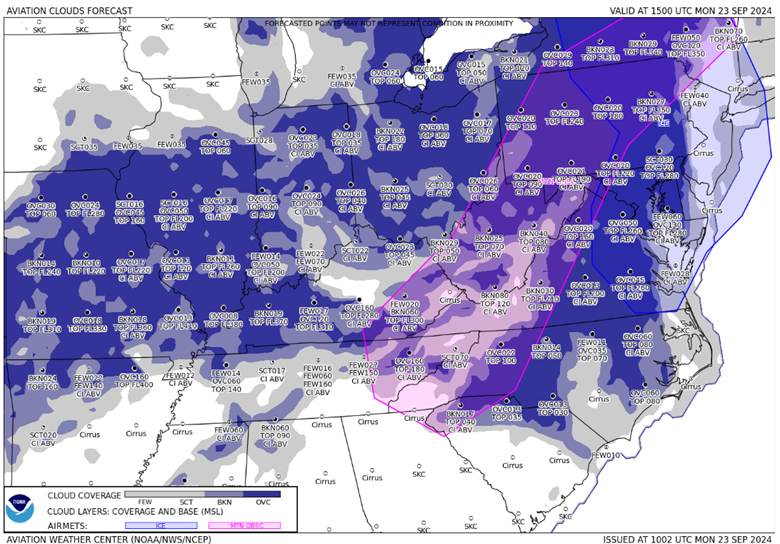
- The Aviation Forecasts include gridded displays of various weather parameters as well as NWS textual weather observations, forecasts, and warnings. Icing, turbulence, and wind gridded products are three-dimensional. Other gridded products are two-dimensional and may represent a “composite” of a three-dimensional weather phenomenon or a surface weather variable, such as horizontal visibility. The following are examples of aviation forecasts depicted on the GFA:
- Preflight Briefing
- Flight Service is one of the primary sources for obtaining preflight briefings and to file flight plans by phone or the Internet. Flight Service Specialists are qualified and certificated as Pilot Weather Briefers by the FAA. They are not authorized to make original forecasts, but are authorized to translate and interpret available forecasts and reports directly into terms describing the weather conditions which you can expect along your flight route and at your destination. Prior to every flight, pilots should gather all information vital to the nature of the flight. Pilots can receive a regulatory compliant briefing without contacting Flight Service. Pilots are encouraged to use automated resources and review AC 91-92, Pilot's Guide to a Preflight Briefing, for more information. Pilots who prefer to contact Flight Service are encouraged to conduct a self-brief prior to calling. Conducting a self-brief before contacting Flight Service provides familiarity of meteorological and aeronautical conditions applicable to the route of flight and promotes a better understanding of weather information.
Three basic types of preflight briefings (Standard, Abbreviated, and Outlook) are available to serve the pilot's specific needs. Pilots should specify to the briefer the type of briefing they want, along with their appropriate background information. This will enable the briefer to tailor the information to the pilot's intended flight. The following paragraphs describe the types of briefings available and the information provided in each briefing. - Standard Briefing. You should request a Standard Briefing any time you are planning a flight and you have not received a previous briefing or have not received preliminary information through online resources. International data may be inaccurate or incomplete. If you are planning a flight outside of U.S. controlled airspace, the briefer will advise you to check data as soon as practical after entering foreign airspace, unless you advise that you have the international cautionary advisory. The briefer will automatically provide the following information in the sequence listed, except as noted, when it is applicable to your proposed flight.
- Adverse Conditions. Significant meteorological and/or aeronautical information that might influence the pilot to alter or cancel the proposed flight; for example, hazardous weather conditions, airport closures, air traffic delays, etc. Pilots should be especially alert for current or forecast weather that could reduce flight minimums below VFR or IFR conditions. Pilots should also be alert for any reported or forecast icing if the aircraft is not certified for operating in icing conditions. Flying into areas of icing or weather below minimums could have disastrous results.
- VFR Flight Not Recommended. When VFR flight is proposed and sky conditions or visibilities are present or forecast, surface or aloft, that, in the briefer's judgment, would make flight under VFR doubtful, the briefer will describe the conditions, describe the affected locations, and use the phrase “VFR flight not recommended.” This recommendation is advisory in nature. The final decision as to whether the flight can be conducted safely rests solely with the pilot. Upon receiving a “VFR flight not recommended” statement, the non-IFR rated pilot will need to make a “go or no go” decision. This decision should be based on weighing the current and forecast weather conditions against the pilot's experience and ratings. The aircraft's equipment, capabilities and limitations should also be considered.
- Synopsis. A brief statement describing the type, location, and movement of weather systems and/or air masses which might affect the proposed flight.
- Current Conditions. Reported weather conditions applicable to the flight will be summarized from all available sources; e.g., METARs, PIREPs, RAREPs. This element may be omitted if the proposed time of departure is beyond two hours, unless the information is specifically requested by the pilot. For more detailed information on PIREPS, users can refer to the current version of AC 00-45, Aviation Weather Services.
- En Route Forecast. En route conditions forecast for the proposed route are summarized in logical order; i.e., departure-climbout, en route, and descent.
- Destination Forecast. The destination forecast (TAF) for the planned estimated time of arrival (ETA). Any significant changes within 1 hour before and after the planned arrival are included.
- Winds Aloft. Forecast winds aloft for the proposed route will be provided in knots and degrees, referenced to true north. The briefer will interpolate wind directions and speeds between levels and stations as necessary to provide expected conditions at planned altitudes.
- Notices to Airmen (NOTAMs)
- Available NOTAM (D) information pertinent to the proposed flight, including special use airspace (SUA) NOTAMs for restricted areas, aerial refueling, and night vision goggles (NVG).
- Prohibited Areas P-40, P-49, P-56, and the special flight rules area (SFRA) for Washington, DC.
- FSS briefers do not provide FDC NOTAM information for special instrument approach procedures unless specifically asked. Pilots authorized by the FAA to use special instrument approach procedures must specifically request FDC NOTAM information for these procedures.
- Air Traffic Control (ATC) Delays. Any known ATC delays and flow control advisories which might affect the proposed flight.
- Pilots may obtain the following from flight service station briefers upon request:
- Information on Special Use Airspace (SUA) and SUA related airspace, except those listed in paragraph 3.8.2.8.
- A review of airway NOTAMs, procedural NOTAMs, and NOTAMs that are general in nature and not tied to a specific airport/facility (for example, flight advisories and restrictions, open duration special security instructions, and special flight rules areas), Domestic Notices and International Notices. Domestic Notices and International Notices are found in the External Links section of the Federal NOTAM System (FNS) NOTAM Search System.
- Approximate density altitude data.
- Information regarding such items as air traffic services and rules, customs/immigration procedures, ADIZ rules, and search and rescue.
- NOTAMs, available military NOTAMs, runway friction measurement value NOTAMs.
- GPS RAIM availability for 1 hour before to 1 hour after ETA, or a time specified by the pilot.
- Other assistance as required.
- Abbreviated Briefing. Request an Abbreviated Briefing when you need information to supplement mass disseminated data, to update a previous briefing, or when you need only one or two specific items. Provide the briefer with appropriate background information, the time you received the previous information, and/or the specific items needed. You should indicate the source of the information already received so that the briefer can limit the briefing to the information that you have not received, and/or appreciable changes in meteorological/aeronautical conditions since your previous briefing. To the extent possible, the briefer will provide the information in the sequence shown for a Standard Briefing. If you request only one or two specific items, the briefer will advise you if adverse conditions are present or forecast. Adverse conditions contain both meteorological and aeronautical information. Details on these conditions will be provided at your request.
- Outlook Briefing. You should request an Outlook Briefing whenever your proposed time of departure is 6 or more hours from the time of the briefing. The briefer will provide available forecast data applicable to the proposed flight. This type of briefing is provided for planning purposes only. You should obtain a Standard or Abbreviated Briefing prior to departure in order to obtain such items as adverse conditions, current conditions, updated forecasts, winds aloft, and NOTAMs.
- Inflight Briefing. You are encouraged to conduct a self-briefing using online resources or obtain your preflight briefing by telephone or in person before departure (Alaska only). In those cases where you need to obtain a preflight briefing or an update to a previous briefing by radio, you should contact the nearest FSS to obtain this information. After communications have been established, advise the specialist of the type briefing you require and provide appropriate background information. You will be provided information as specified in the above paragraphs, depending on the type of briefing requested. En Route advisories tailored to the phase of flight that begins after climb-out and ends with descent to land are provided upon pilot request. Besides flight service, there are other resources available to the pilot inflight, including:
Automatic Dependent Surveillance-Broadcast (ADS-B). Free traffic, weather, and flight information are available on ADS-B In receivers that can receive data over 978 MHz (UAT) broadcasts. These services are available across the nation to aircraft owners who equip with ADS-B In, with further advances coming from airborne and runway traffic awareness. Even search-and-rescue operations benefit from accurate ADS-B tracking.
Flight Information Services-Broadcast (FIS-B). FIS-B is a free service; but is only available to aircraft who can receive data over 978 MHz (UAT). FIS-B automatically transmits a wide range of weather products with national and regional focus to all equipped aircraft. Having current weather and aeronautical information in the cockpit helps pilots plan more safe and efficient flight paths, as well as make strategic decisions during flight to avoid potentially hazardous weather.
Pilots are encouraged to provide a continuous exchange of information on weather, winds, turbulence, flight visibility, icing, etc., between pilots and inflight specialists. Pilots should report good weather as well as bad, and confirm expected conditions as well as unexpected. Remember that weather conditions can change rapidly and that a “go or no go” decision, as mentioned in paragraph 3.8.2.2, should be assessed at all phases of flight. - Following any briefing, feel free to ask for any information that you or the briefer may have missed. It helps to save your questions until the briefing has been completed. This way the briefer is able to present the information in a logical sequence and lessens the chance of important items being overlooked.
- Flight Service is one of the primary sources for obtaining preflight briefings and to file flight plans by phone or the Internet. Flight Service Specialists are qualified and certificated as Pilot Weather Briefers by the FAA. They are not authorized to make original forecasts, but are authorized to translate and interpret available forecasts and reports directly into terms describing the weather conditions which you can expect along your flight route and at your destination. Prior to every flight, pilots should gather all information vital to the nature of the flight. Pilots can receive a regulatory compliant briefing without contacting Flight Service. Pilots are encouraged to use automated resources and review AC 91-92, Pilot's Guide to a Preflight Briefing, for more information. Pilots who prefer to contact Flight Service are encouraged to conduct a self-brief prior to calling. Conducting a self-brief before contacting Flight Service provides familiarity of meteorological and aeronautical conditions applicable to the route of flight and promotes a better understanding of weather information.
- Inflight Aviation Weather Advisories
- Inflight Aviation Weather Advisories are forecasts to advise en route aircraft of development of potentially hazardous weather. Inflight aviation weather advisories in the conterminous U.S. are issued by the Aviation Weather Center (AWC) in Kansas City, MO, as well as 20 Center Weather Service Units (CWSU) associated with ARTCCs. AWC also issues advisories for portions of the Gulf of America, Atlantic and Pacific Oceans, which are under the control of ARTCCs with Oceanic flight information regions (FIRs). The Weather Forecast Office (WFO) in Honolulu issues advisories for the Hawaiian Islands and a large portion of the Pacific Ocean. In Alaska, the Alaska Aviation Weather Unit (AAWU) issues inflight aviation weather advisories along with the Anchorage CWSU. All heights are referenced MSL, except in the case of ceilings (CIG) which indicate AGL.
- There are four types of inflight aviation weather advisories: the SIGMET, the Convective SIGMET, the AIRMET, and the Center Weather Advisory (CWA). All of these advisories use VORs, airports, or well-known geographic areas to describe the hazardous weather areas.
- The Severe Weather Watch Bulletins (WWs), (with associated Alert Messages) (AWW) supplements these Inflight Aviation Weather Advisories.
- SIGMET. A SIGMET is a concise description of the occurrence or expected occurrence of specified en route weather phenomena which is expected to affect the safety of aircraft operations.
- SIGMETs:
- Are intended for dissemination to all pilots in flight to enhance safety.
- Are issued by the responsible MWO as soon as it is practical to alert operators and aircrews of hazardous en route conditions.
- Are unscheduled products that are valid for 4 hours; except SIGMETs associated with tropical cyclones and volcanic ash clouds are valid for 6 hours. Unscheduled updates and corrections are issued as necessary.
- Use geographical points to describe the hazardous weather areas. These points can reference either VORs, airports, or latitude-longitude depending on SIGMET location. If the total area to be affected during the forecast period is very large, it could be that in actuality only a small portion of this total area would be affected at any one time.
- SIGMETs over the contiguous U.S.:
- Are issued corresponding to the areas described in FIG GEN 3.5-5 and are only for non-convective weather. The U.S. issues a special category of SIGMETs for convective weather called Convective SIGMETs.
- Are identified by an alphabetic designator, from November through Yankee, excluding Sierra and Tango. Issuance for the same phenomenon will be sequentially numbered using the original designator until the phenomenon ends. For example, the first issuance in the Chicago (CHI) area (reference FIG GEN 3.5-5) for phenomenon moving from the Salt Lake City (SLC) area will be SIGMET Papa 3, if the previous two issuances, Papa 1 and Papa 2, had been in the SLC area. Note that no two different phenomena across the country can have the same alphabetic designator at the same time.
- Use location identifiers (either VORs or airports) to describe the hazardous weather areas.
- Are issued when the following phenomena occur or are expected to occur:
- Severe icing not associated with thunderstorms.
- Severe or extreme turbulence or clear air turbulence (CAT) not associated with thunderstorms.
- Widespread dust storms or sandstorms lowering surface visibilities to below 3 miles.
- Volcanic ash.
- SIGMETs over Alaska:
- Are issued for the Anchorage FIR including Alaska and nearby coastal waters corresponding to the areas described in FIG GEN 3.5-4 and are only for non-convective weather. The U.S. issues a special category of SIGMETs for convective weather called Convective SIGMETs.
- Use location identifiers (either VORs or airports) to describe the hazardous weather areas.
- Use points of latitude and longitude over the ocean areas of the Alaska FIR.
- Are identified by an alphabetic designator from India through Mike.
- In addition to the phenomenon applicable to SIGMETs over the contiguous U.S., SIGMETs over Alaska are also issued for:
- Tornadoes.
- Lines of thunderstorms.
- Embedded thunderstorms.
- Hail greater than or equal to ¾ inch in diameter.
FIG GEN 3.5-4Alaska SIGMET and Area Forecast Zones 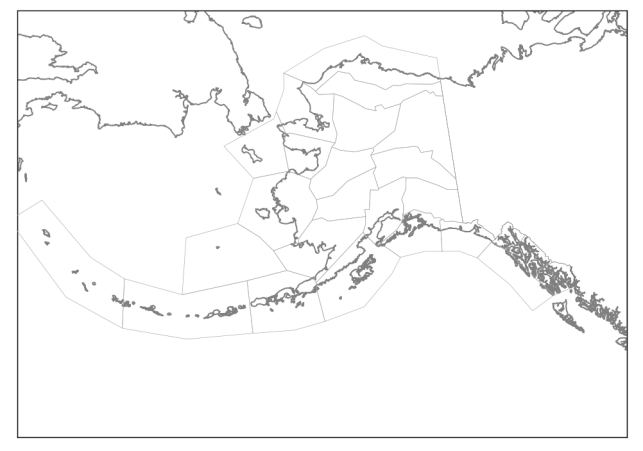
- SIGMETs over oceanic regions (New York Oceanic FIR, Oakland Oceanic FIR including Hawaii, Houston Oceanic FIR, Miami Oceanic FIR, San Juan FIR), points of latitude and longitude are used to describe the hazard area.
- SIGMETs over the Oakland Oceanic FIR west of 140 west and south of 30 north (including the Hawaiian Islands), are identified by an alphabetic designator from November through Zulu.
- SIGMETs over the Oakland Oceanic FIR east of 140 west and north of 30 north are identified by an alphabetic designator from Alpha through Mike.
- SIGMETs over the New York Oceanic FIR, Houston Oceanic FIR, Miami Oceanic FIR, and San Juan FIR are identified by an alphabetic designator from Alpha through Mike.
- In addition to SIGMETs issued for the phenomenon for the contiguous U.S., SIGMETs in the oceanic regions are also issued for:
- Tornadoes.
- Lines of thunderstorms.
- Embedded thunderstorms.
- Hail greater than or equal to ¾ inch in diameter.
- SIGMETs:
- Convective SIGMET
- Convective SIGMETs are issued in the conterminous U.S. for any of the following:
- Severe thunderstorm due to:
- Surface winds greater than or equal to 50 knots.
- Hail at the surface greater than or equal to 3/4 inches in diameter.
- Tornadoes.
- Embedded thunderstorms.
- A line of thunderstorms.
- Thunderstorms producing precipitation greater than or equal to heavy precipitation affecting 40 percent or more of an area at least 3,000 square miles.
- Severe thunderstorm due to:
- Any convective SIGMET implies severe or greater turbulence, severe icing, and low-level wind shear. A convective SIGMET may be issued for any convective situation that the forecaster feels is hazardous to all categories of aircraft.
- Convective SIGMET bulletins are issued for the western (W), central (C), and eastern (E) United States. (Convective SIGMETs are not issued for Alaska or Hawaii.) The areas are separated at 87 and 107 degrees west longitude with sufficient overlap to cover most cases when the phenomenon crosses the boundaries. Bulletins are issued hourly at H+55. Special bulletins are issued at any time as required and updated at H+55. If no criteria meeting convective SIGMET requirements are observed or forecasted, the message “CONVECTIVE SIGMET... NONE” will be issued for each area at H+55. Individual convective SIGMETs for each area (W, C, E) are numbered sequentially from number one each day, beginning at 00Z. A convective SIGMET for a continuing phenomenon will be reissued every hour at H+55 with a new number. The text of the bulletin consists of either an observation and a forecast or just a forecast. The forecast is valid for up to 1 hour.
FIG GEN 3.5-5SIGMET Locations – Contiguous U.S. 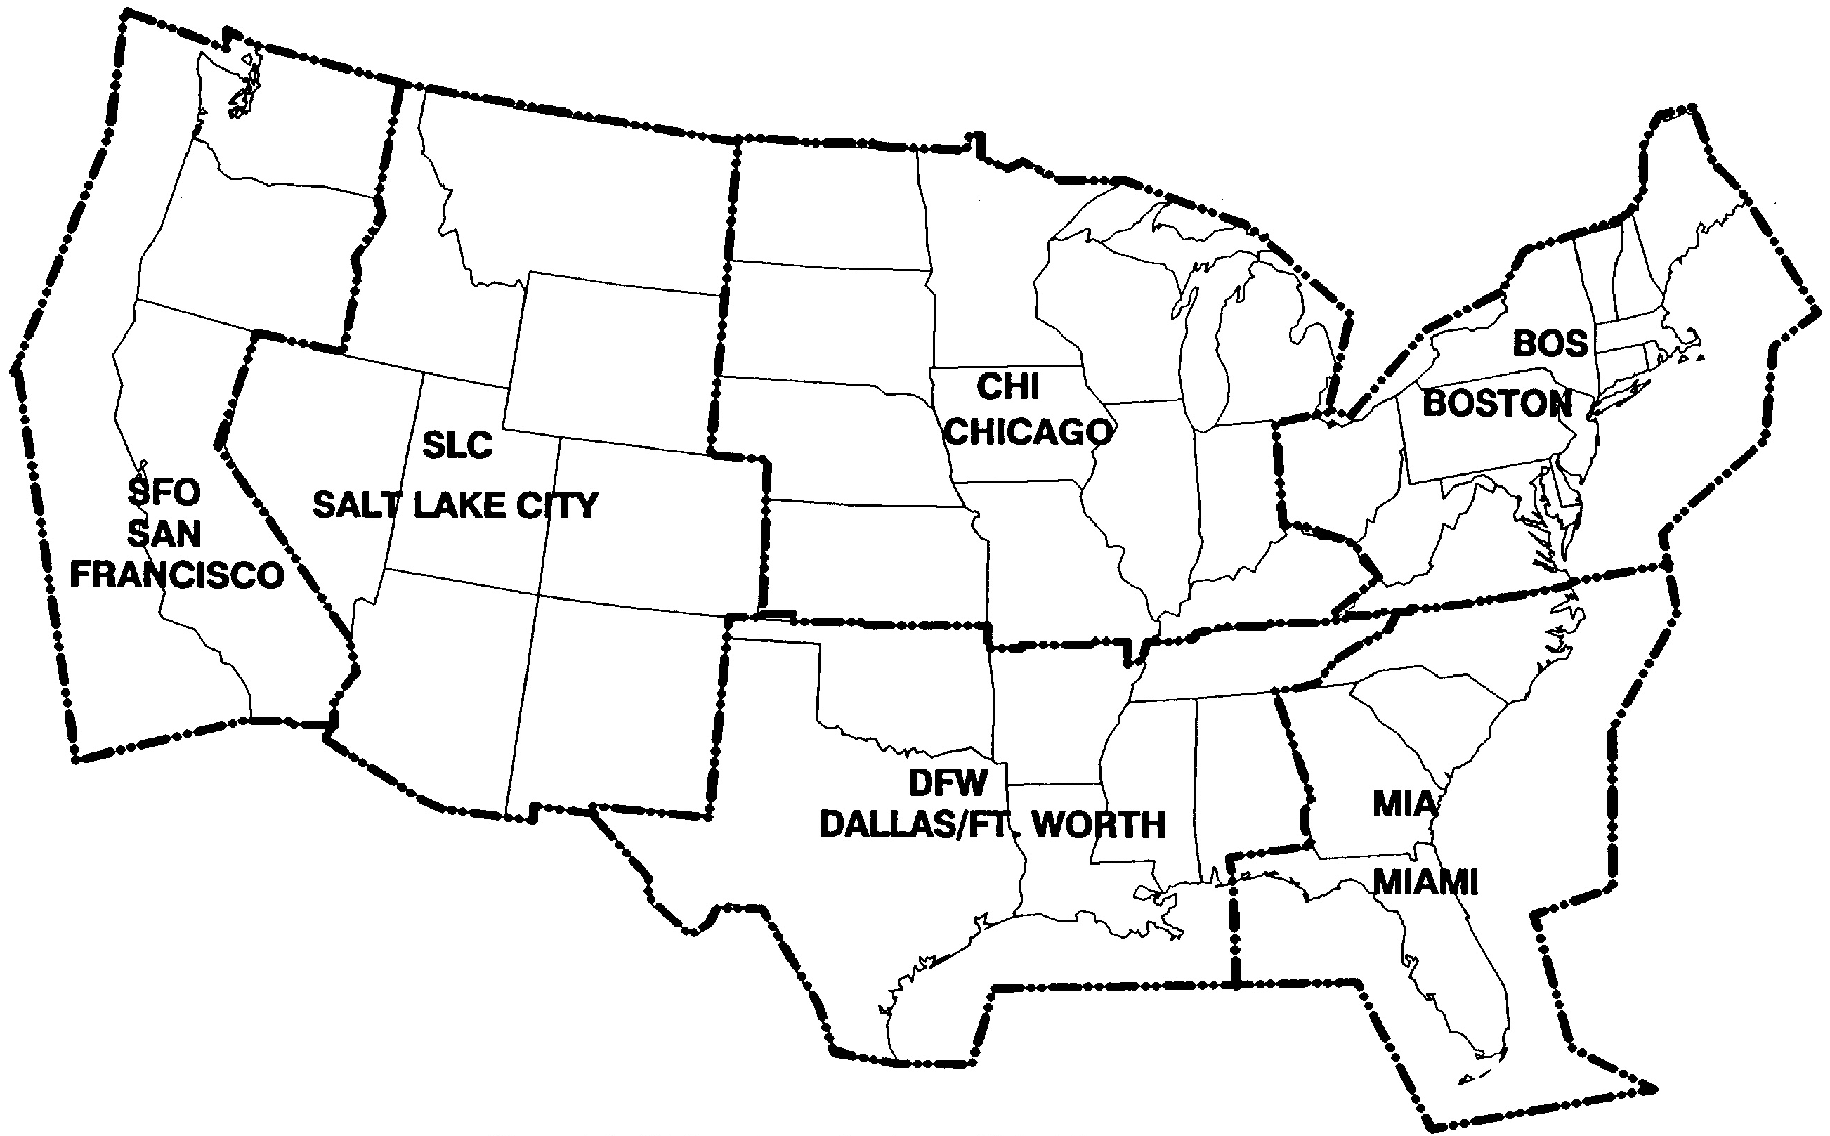
FIG GEN 3.5-6Hawaii Area Forecast Locations 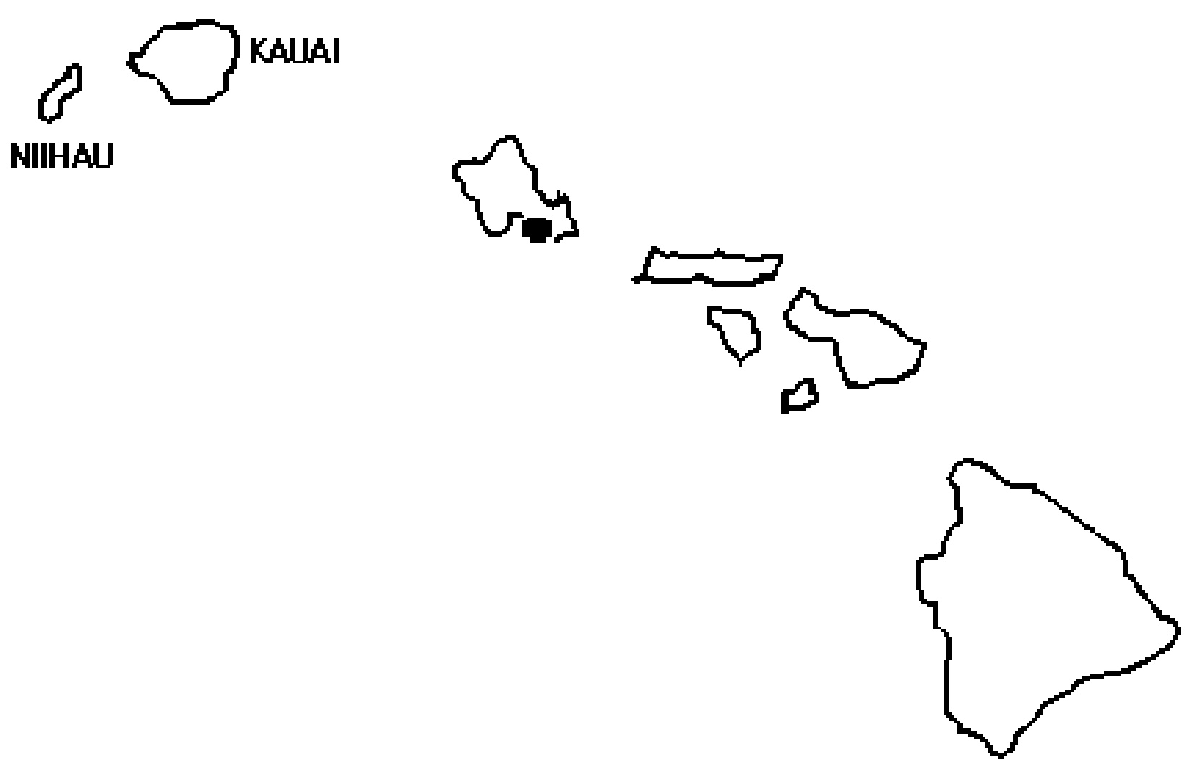
- Convective SIGMETs are issued in the conterminous U.S. for any of the following:
- AIRMET. An AIRMET is a concise description of the occurrence or expected occurrence of specified en route weather phenomena that may affect the safety of aircraft operations, but at intensities lower than those which require the issuance of a SIGMET.
- AIRMETS contain details about Instrument Flight Rule (IFR) conditions, extensive mountain obscuration, turbulence, strong surface winds, icing, and freezing levels. Unscheduled updates and corrections are issued as necessary.
- AIRMETs:
- Are intended to inform all pilots, but especially Visual Flight Rules pilots and operators of sensitive aircraft, of potentially hazardous weather phenomena.
- Are issued on a scheduled basis every 6 hours, except every 8 hours in Alaska. Unscheduled updates and corrections are issued as necessary.
- Are intended for dissemination to all pilots in the preflight and en route phase of flight to enhance safety. En route, AIRMETs are available over Flight Service frequencies. Over the contiguous U.S., AIRMETs are also available on equipment intended to display weather and other non-air traffic control-related flight information to pilots using the Flight Information Service-Broadcast (FIS-B). In Alaska and Hawaii, AIRMETs are broadcast on air traffic frequencies.
- Are issued for the contiguous U.S., Alaska, and Hawaii. No AIRMETs are issued for U.S. Oceanic FIRs in the Gulf of America, Caribbean, Western Atlantic and Pacific Oceans.
TBL GEN 3.5-3U.S. AIRMET Issuance Time and Frequency Product Type
Issuance Time
Issuance Frequency
AIRMETs over the Contiguous U.S.
0245, 0845, 1445, 2045 UTC
Every 6 hours
AIRMETs over Alaska
0515, 1315, 2115 UTC
(standard time)0415, 1215, 2015 UTC
(Daylight savings time)Every 8 hours
AIRMETs over Hawaii
0400, 1000, 1600, 2200 UTC
Every 6 hours
- AIRMETs over the Contiguous U.S.:
- Are displayed graphically on websites, such as aviationweather.gov and 1800wxbrief.com, and equipment receiving FIS-B information.
- Provide a higher forecast resolution than AIRMETs issued in text format.
- Are valid at discrete times no more than 3 hours apart for a period of up to 12 hours into the future (for example; 00, 03, 06, 09, and 12 hours). Additional forecasts may be inserted during the first 6 hours (for example; 01, 02, 04, and 05). 00-hour represents the initial conditions, and the subsequent graphics depict the area affected by the particular hazard at that valid time. Forecasts valid at 00 through 06 hours correspond to the text AIRMET bulletin.
- Depict the following en route aviation weather hazards:
- Instrument flight rule conditions (ceiling < 1000' and/or surface visibility <3 miles).
- Widespread mountain obscuration.
- Moderate icing.
- Freezing levels.
- Moderate turbulence.
- Non-convective low-level wind shear potential below 2,000 feet AGL.
- Sustained surface winds greater than 30 knots.
- Interpolation of time periods between AIRMETs over the contiguous U.S. valid times: Users must keep in mind when using the AIRMET over the contiguous U.S. that if a 00-hour forecast shows no significant weather and a 03-hour forecast shows hazardous weather, they must assume a change is occurring during the period between the two forecasts. It should be taken into consideration that the hazardous weather starts immediately after the 00-hour forecast unless there is a defined initiation or ending time for the hazardous weather. The same would apply after the 03-hour forecast. The user should assume the hazardous weather condition is occurring between the snapshots unless informed otherwise. For example, if a 00-hour forecast shows no hazard, a 03-hour forecast shows the presence of hazardous weather, and a 06-hour forecast shows no hazard, the user should assume the hazard exists from the 0001 hour to the 0559 hour time period.
FIG GEN 3.5-7AIRMETs over the Contiguous U.S. 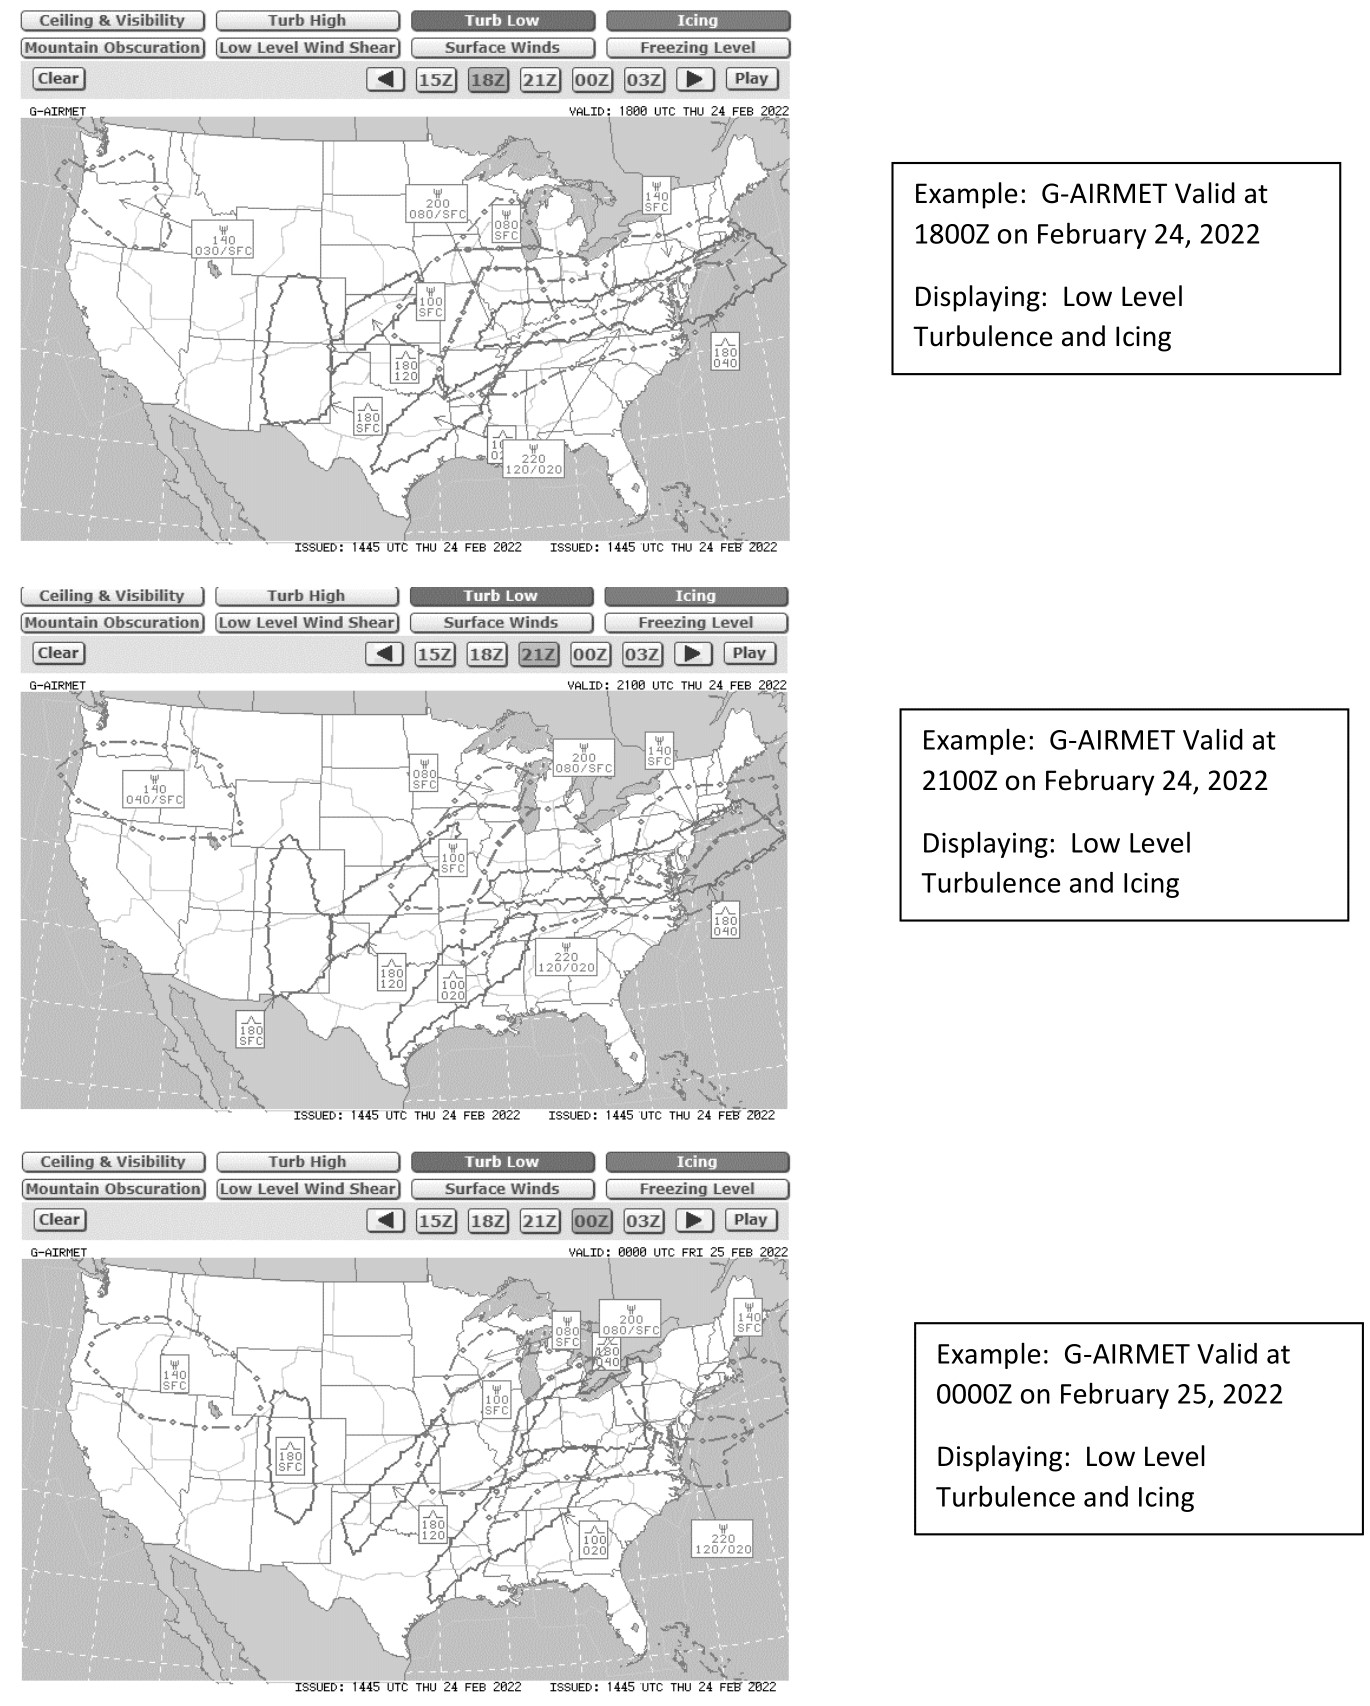
- AIRMETs over Alaska and Hawaii:
- AIRMETs over Alaska and Hawaii are in text format. The hazard areas are described using well-known geographical areas. AIRMETs over Alaska are issued for three Alaskan regions corresponding to Alaska area forecasts (See FIG GEN 3.5-4).
- AIRMETs over Alaska are valid up to eight hours. AIRMETs over Hawaii are valid up to six hours. Unscheduled issuances contain an update number for easier identification.
- AIRMET Zulu describes moderate icing and provides freezing level heights.
- Watch Notification Messages
The Storm Prediction Center (SPC) in Norman, OK, issues Watch Notification Messages to provide an area threat alert for forecast organized severe thunderstorms that may produce tornadoes, large hail, and/or convective damaging winds within the CONUS. SPC issues three types of watch notification messages: Aviation Watch Notification Messages, Public Severe Thunderstorm Watch Notification Messages, and Public Tornado Watch Notification Messages.
It is important to note the difference between a Severe Thunderstorm (or Tornado) Watch and a Severe Thunderstorm (or Tornado) Warning. A watch means severe weather is possible during the next few hours, while a warning means that severe weather has been observed, or is expected within the hour. Only the SPC issues Severe Thunderstorm and Tornado Watches, while only NWS Weather Forecasts Offices issue Severe Thunderstorm and Tornado Warnings.
- The Aviation Watch Notification Message. The Aviation Watch Notification Message product is an approximation of the area of the Public Severe Thunderstorm Watch or Public Tornado Watch. The area may be defined as a rectangle or parallelogram using VOR navigational aides as coordinates.
The Aviation Watch Notification Message was formerly known as the Alert Severe Weather Watch Bulletin (AWW). The NWS no longer uses that title or acronym for this product. The NWS uses the acronym SAW for the Aviation Watch Notification Message, but retains AWW in the product header for processing by weather data systems.
- Public Severe Thunderstorm Watch Notification Messages describe areas of expected severe thunderstorms. (Severe thunderstorm criteria are 1‐inch hail or larger and/or wind gusts of 50 knots [58 mph] or greater). A Public Severe Thunderstorm Watch Notification Message contains the area description and axis, the watch expiration time, a description of hail size and thunderstorm wind gusts expected, the definition of the watch, a call to action statement, a list of other valid watches, a brief discussion of meteorological reasoning and technical information for the aviation community.
- Public Tornado Watch Notification Messages describe areas where the threat of tornadoes exists. A Public Tornado Watch Notification Message contains the area description and axis, watch expiration time, the term “damaging tornadoes,” a description of the largest hail size and strongest thunderstorm wind gusts expected, the definition of the watch, a call to action statement, a list of other valid watches, a brief discussion of meteorological reasoning and technical information for the aviation community. SPC may enhance a Public Tornado Watch Notification Message by using the words “THIS IS A PARTICULARLY DANGEROUS SITUATION” when there is a likelihood of multiple strong (damage of EF2 or EF3) or violent (damage of EF4 or EF5) tornadoes.
- Public severe thunderstorm and tornado watch notification messages were formerly known as the Severe Weather Watch Bulletins (WW). The NWS no longer uses that title or acronym for this product but retains WW in the product header for processing by weather data systems.
- Status reports are issued as needed to show progress of storms and to delineate areas no longer under the threat of severe storm activity. Cancellation bulletins are issued when it becomes evident that no severe weather will develop or that storms have subsided and are no longer severe.
- The Aviation Watch Notification Message. The Aviation Watch Notification Message product is an approximation of the area of the Public Severe Thunderstorm Watch or Public Tornado Watch. The area may be defined as a rectangle or parallelogram using VOR navigational aides as coordinates.
- Center Weather Advisories (CWA)
- CWAs are unscheduled inflight, flow control, air traffic, and air crew advisory. By nature of its short lead time, the CWA is not a flight planning product. It is generally a nowcast for conditions beginning within the next two hours. CWAs will be issued:
- As a supplement to an existing SIGMET, Convective SIGMET or AIRMET.
- When an Inflight Advisory has not been issued but observed or expected weather conditions meet SIGMET/AIRMET criteria based on current pilot reports and reinforced by other sources of information about existing meteorological conditions.
- When observed or developing weather conditions do not meet SIGMET, Convective SIGMET, or AIRMET criteria; e.g., in terms of intensity or area coverage, but current pilot reports or other weather information sources indicate that existing or anticipated meteorological phenomena will adversely affect the safe flow of air traffic within the ARTCC area of responsibility.
- The following example is a CWA issued from the Kansas City, Missouri, ARTCC. The “3” after ZKC in the first line denotes this CWA has been issued for the third weather phenomena to occur for the day. The “301” in the second line denotes the phenomena number again (3) and the issuance number (01) for this phenomena. The CWA was issued at 2140Z and is valid until 2340Z.
- CWAs are unscheduled inflight, flow control, air traffic, and air crew advisory. By nature of its short lead time, the CWA is not a flight planning product. It is generally a nowcast for conditions beginning within the next two hours. CWAs will be issued:
4.. Categorical Ceiling and Visibility Conditions
- Categorical terms, describing either reported or forecast general ceiling and visibility conditions, are defined as follows:
- LIFR (Low IFR). Ceiling less than 500 feet and/or visibility less than 1 mile.
- IFR. Ceiling 500 to less than 1,000 feet and/or visibility 1 to less than 3 miles.
- MVFR (Marginal VFR) . Ceiling 1,000 or 3,000 feet and/or visibility 3 to 5 miles inclusive.
- VFR. Ceiling greater than 3,000 feet and visibility greater than 5 miles; includes sky clear.
- The cause of LIFR, IFR, or MVFR is indicated by either ceiling or visibility restrictions or both. The contraction “CIG” and/or weather and obstruction to vision symbols are used. If winds or gusts of 25 knots or greater are forecast for the outlook period, the word “WIND” is also included for all categories, including VFR.
5.. Inflight Weather Advisory Broadcasts
ARTCCs broadcast a Convective SIGMET, SIGMET, AIRMET (except in the contiguous U.S.), Urgent Pilot Report, or CWA alert once on all frequencies, except emergency frequencies, when any part of the area described is within 150 miles of the airspace under their jurisdiction. These broadcasts advise pilots of the availability of hazardous weather advisories and to contact the nearest flight service facility for additional details.
6.. Flight Information Services (FIS)
- FIS. FIS is a method of disseminating meteorological (MET) and aeronautical information (AI) to displays in the cockpit in order to enhance pilot situational awareness, provide decision support tools, and improve safety. FIS augments traditional pilot voice communication with Flight Service Stations (FSSs), ATC facilities, or Airline Operations Control Centers (AOCCs). FIS is not intended to replace traditional pilot and controller/flight service specialist/aircraft dispatcher preflight briefings or inflight voice communications. FIS, however, can provide textual and graphical information that can help abbreviate and improve the usefulness of such communications. FIS enhances pilot situational awareness and improves safety.
- Data link Service Providers (DSPs). DSPs deploy and maintain airborne, ground-based, and, in some cases, space-based infrastructure that supports the transmission of AI/MET information over one or more physical links. A DSP may provide a free of charge or a for-fee service that permits end users to uplink and downlink AI/MET and other information. The following are examples of DSPs:
- FAA FIS‐B. A ground‐based broadcast service provided through the ADS‐B Universal Access Transceiver (UAT) network. The service provides users with a 978 MHz data link capability when operating within range and line‐of‐sight of a transmitting ground station. FIS‐B enables users of properly equipped aircraft to receive and display a suite of broadcast weather and aeronautical information products.
- Non‐FAA FIS Systems. Several commercial vendors provide customers with FIS data over both the aeronautical spectrum and on other frequencies using a variety of data link protocols. Services available from these providers vary greatly and may include tier based subscriptions. Advancements in bandwidth technology permits preflight as well as inflight access to the same MET and AI information available on the ground. Pilots and operators using non‐FAA FIS for MET and AI information should be knowledgeable regarding the weather services being provided as some commercial vendors may be repackaging NWS sourced weather, while other commercial vendors may alter the weather information to produce vendor-tailored or vendor-specific weather reports and forecasts.
- Three Data Link Modes. There are three data link modes that may be used for transmitting AI and MET information to aircraft. The intended use of the AI and/or MET information will determine the most appropriate data link service.
- Broadcast Mode: A one‐way interaction in which AI and/or MET updates or changes applicable to a designated geographic area are continuously transmitted (or transmitted at repeated periodic intervals) to all aircraft capable of receiving the broadcast within the service volume defined by the system network architecture.
- Contract/Demand Mode: A two‐way interaction in which AI and/or MET information is transmitted to an aircraft in response to a specific request.
- Contract/Update Mode: A two‐way interaction that is an extension of the Demand Mode. Initial AI and/or MET report(s) are sent to an aircraft and subsequent updates or changes to the AI and/or MET information that meet the contract criteria are automatically or manually sent to an aircraft.
- To ensure airman compliance with Federal Aviation Regulations, manufacturer's operating manuals should remind airmen to contact ATC controllers, FSS specialists, operator dispatchers, or airline operations control centers for general and mission critical aviation weather information and/or NAS status conditions (such as NOTAMs, Special Use Airspace status, and other government flight information). If FIS products are systemically modified (for example, are displayed as abbreviated plain text and/or graphical depictions), the modification process and limitations of the resultant product should be clearly described in the vendor's user guidance.
- Operational Use of FIS. Regardless of the type of FIS system being used, several factors must be considered when using FIS:
- Before using FIS for inflight operations, pilots and other flight crewmembers should become familiar with the operation of the FIS system to be used, the airborne equipment to be used, including its system architecture, airborne system components, coverage service volume and other limitations of the particular system, modes of operation and indications of various system failures. Users should also be familiar with the specific content and format of the services available from the FIS provider(s). Sources of information that may provide this specific guidance include manufacturer's manuals, training programs, and reference guides.
- FIS should not serve as the sole source of aviation weather and other operational information. ATC, FSSs, and, if applicable, AOCC VHF/HF voice remain as a redundant method of communicating aviation weather, NOTAMs, and other operational information to aircraft in flight. FIS augments these traditional ATC/FSS/AOCC services and, for some products, offers the advantage of being displayed as graphical information. By using FIS for orientation, the usefulness of information received from conventional means may be enhanced. For example, FIS may alert the pilot to specific areas of concern that will more accurately focus requests made to FSS or AOCC for inflight updates or similar queries made to ATC.
- The airspace and aeronautical environment is constantly changing. These changes occur quickly and without warning. Critical operational decisions should be based on use of the most current and appropriate data available. When differences exist between FIS and information obtained by voice communication with ATC, FSS, and/or AOCC (if applicable), pilots are cautioned to use the most recent data from the most authoritative source.
- FIS aviation weather products (for example, graphical ground-based radar precipitation depictions) are not appropriate for tactical (typical timeframe of less than 3 minutes) avoidance of severe weather such as negotiating a path through a weather hazard area. FIS supports strategic (typical timeframe of 20 minutes or more) weather decision-making such as route selection to avoid a weather hazard area in its entirety. The misuse of information beyond its applicability may place the pilot and aircraft in jeopardy. In addition, FIS should never be used in lieu of an individual preflight weather and flight planning briefing.
- DSPs offer numerous MET and AI products with information that can be layered on top of each other. Pilots need to be aware that too much information can have a negative effect on their cognitive work load. Pilots need to manage the amount of information to a level that offers the most pertinent information to that specific flight without creating a cockpit distraction. Pilots may need to adjust the amount of information based on numerous factors including, but not limited to, the phase of flight, single pilot operation, autopilot availability, class of airspace, and the weather conditions encountered.
- FIS NOTAM products, including Temporary Flight Restriction (TFR) information, are advisory-use information and are intended for situational awareness purposes only. Cockpit displays of this information are not appropriate for tactical navigation - pilots should stay clear of any geographic area displayed as a TFR NOTAM. Pilots should contact FSSs and/or ATC while en route to obtain updated information and to verify the cockpit display of NOTAM information.
- FIS supports better pilot decision-making by increasing situational awareness. Better decision-making is based on using information from a variety of sources. In addition to FIS, pilots should take advantage of other weather/NAS status sources, including, briefings from Flight Service Stations, data from other air traffic control facilities, airline operation control centers, pilot reports, as well as their own observations.
- FAA's Flight Information Service-Broadcast (FIS-B).
- FIS-B is a ground-based broadcast service provided through the FAA's Automatic Dependent Surveillance–Broadcast (ADS-B) Services Universal Access Transceiver (UAT) network. The service provides users with a 978 MHz data link capability when operating within range and line-of-sight of a transmitting ground station. FIS-B enables users of properly-equipped aircraft to receive and display a suite of broadcast weather and aeronautical information products.
- TBL GEN 3.5-4lists the text and graphical products available throughFIS-Band provided free-of-charge. Detailed information concerningFIS-Bmeteorological products can be found in FAA-H-8083-28, Aviation Weather Handbook and AC 00-63, Use of Cockpit Displays of Digital Weather and Aeronautical Information. Information on Special Use Airspace (SUA), Temporary Flight Restriction (TFR), and Notice to Airmen (NOTAM) products can be found in Chapters ENR 1 and ENR 5 of this manual.
- Users of FIS-B should familiarize themselves with the operational characteristics and limitations of the system, including: system architecture; service environment; product lifecycles; modes of operation; and indications of system failure.
- FIS-B products are updated and transmitted at specific intervals based primarily on product issuance criteria. Update intervals are defined as the rate at which the product data is available from the source for transmission. Transmission intervals are defined as the amount of time within which a new or updated product transmission must be completed and/or the rate or repetition interval at which the product is rebroadcast. Update and transmission intervals for each product are provided in TBL GEN 3.5-4.
- Where applicable, FIS-B products include a look-ahead range expressed in nautical miles (NM) for three service domains: Airport Surface; Terminal Airspace; and Enroute/Gulf-of-America. TBL GEN 3.5-5 provides service domain availability and look-ahead ranging for each FIS-B product.
- Prior to using this capability, users should familiarize themselves with the operation of FIS-B avionics by referencing the applicable User's Guides. Guidance concerning the interpretation of information displayed should be obtained from the appropriate avionics manufacturer.
- FIS-B malfunctions not attributed to aircraft system failures or covered by active NOTAM should be reported by radio or telephone to the nearest FSS facility, or by sending an email to the ADS-B help desk at adsb@faa.gov. Reports should include:
- Condition observed;
- Date and time of observation;
- Altitude and location of observation;
- Type and call sign of the aircraft; and
- Type and software version of avionics system.
- Data link Service Providers (DSPs). DSPs deploy and maintain airborne, ground-based, and, in some cases, space-based infrastructure that supports the transmission of AI/MET information over one or more physical links. A DSP may provide a free of charge or a for-fee service that permits end users to uplink and downlink AI/MET and other information. The following are examples of DSPs:
- Non-FAA FIS Systems. Several commercial vendors also provide customers with FIS data over both the aeronautical spectrum and on other frequencies using a variety of data link protocols. In some cases, the vendors provide only the communications system that carries customer messages, such as the Aircraft Communications Addressing and Reporting System (ACARS) used by many air carrier and other operators.
- Operators using non-FAA FIS data for inflight weather and other operational information should ensure that the products used conform to FAA/NWS standards. Specifically, aviation weather and NAS status information should meet the following criteria:
- The products should be either FAA/NWS “accepted” aviation weather reports or products, or based on FAA/NWS accepted aviation weather reports or products. If products are used which do not meet this criteria, they should be so identified. The operator must determine the applicability of such products to their particular flight operations.
- In the case of a weather product which is the result of the application of a process which alters the form, function or content of the base FAA/NWS accepted weather product(s), that process, and any limitations to the application of the resultant product, should be described in the vendor's user guidance material. An example would be a NEXRAD radar composite/mosaic map, which has been modified by changing the scaling resolution. The methodology of assigning reflectivity values to the resultant image components should be described in the vendor's guidance material to ensure that the user can accurately interpret the displayed data.
TBL GEN 3.5-4FIS-B Over UAT Product Update and Transmission Intervals Product
Update Interval1
Transmission Interval (95%)2
Basic Product
AIRMET
As Available
5 minutes
Yes
AWW/WW
As Available, then at 15 minute intervals for 1 hour
5 minutes
No
Ceiling
As Available
10 minutes
No
Convective SIGMET
As Available, then at 15 minute intervals for 1 hour
5 minutes
Yes
D-ATIS
As Available
1 minute
No
Echo Top
5 minutes
5 minutes
No
METAR/SPECI
1 minute (where available), As Available otherwise
5 minutes
Yes
MRMS NEXRAD (CONUS)
2 minutes
15 minutes
Yes
MRMS NEXRAD (Regional)
2 minutes
2.5 minutes
Yes
NOTAMs-D/FDC
As Available
10 minutes
Yes
NOTAMs-TFR
As Available
10 minutes
Yes
PIREP
As Available
10 minutes
Yes
SIGMET
As Available, then at 15 minute intervals for 1 hour
5 minutes
Yes
SUA Status
As Available
10 minutes
Yes
TAF/AMEND
6 Hours (±15 minutes)
10 minutes
Yes
Temperature Aloft
12 Hours (±15 minutes)
10 minutes
Yes
TWIP
As Available
1 minute
No
Winds aloft
12 Hours (±15 minutes)
10 minutes
Yes
Lightning strikes 3
5 minutes
5 minutes
Yes
Turbulence 3
1 minute
15 minutes
Yes
Icing, Forecast Potential (FIP) 3
60 minutes
15 minutes
Yes
Cloud tops 3
30 minutes
15 minutes
Yes
1 Minute AWOS 3
1 minute
10 minutes
No
Graphical-AIRMET 3
As Available
5 minutes
Yes
Center Weather Advisory (CWA) 3
As Available
10 minutes
Yes
Temporary Restricted Areas (TRA)
As Available
10 minutes
Yes
Temporary Military Operations Areas (TMOA)
As Available
10 minutes
Yes
1The Update Interval is the rate at which the product data is available from the source.
2 The Transmission Interval is the amount of time within which a new or updated product transmission must be completed (95%) and the rate or repetition interval at which the product is rebroadcast (95%).
3 The transmission and update intervals for the expanded set of basic meteorological products may be adjusted based on FAA and vendor agreement on the final product formats and performance requirements.
TBL GEN 3.5-5Product Parameters for Low/Medium/High Altitude Tier Radios Product
Surface Radios
Low Altitude Tier
Medium Altitude Tier
High Altitude Tier
CONUS NEXRAD
N/A
CONUS NEXRAD not provided
CONUS NEXRAD imagery
CONUS NEXRAD imagery
Winds & Temps Aloft
500 NM look-ahead range
500 NM look-ahead range
750 NM look-ahead range
1,000 NM look-ahead range
METAR
100 NM look-ahead range
250 NM look-ahead range
375 NM look-ahead range
CONUS: CONUS Class B & C airport METARs and 500 NM look-ahead range
Outside of CONUS: 500 NM look‐ahead
rangeTAF
100 NM look-ahead range
250 NM look-ahead range
375 NM look-ahead range
CONUS: CONUS Class B & C airport TAFs and 500 NM look-ahead range
Outside of CONUS: 500 NM look‐ahead
rangeAIRMET, SIGMET, PIREP, and SUA/SAA
100 NM look-ahead range. PIREP/SUA/SAA is N/A.
250 NM look-ahead range
375 NM look-ahead range
500 NM look-ahead range
Regional NEXRAD
150 NM look-ahead range
150 NM look-ahead range
200 NM look-ahead range
250 NM look-ahead range
NOTAMs D, FDC, and TFR
100 NM look-ahead range
100 NM look-ahead range
100 NM look-ahead range
100 NM look-ahead range
- Operators using non-FAA FIS data for inflight weather and other operational information should ensure that the products used conform to FAA/NWS standards. Specifically, aviation weather and NAS status information should meet the following criteria:
7.. Weather Observing Programs
- Manual Observations. Aviation Routine Weather Reports (METAR) are taken at more than 600 locations in the U.S. With only a few exceptions, these stations are located at airport sites and most are staffed by FAA personnel who manually observe, perform calculations, and enter the observation into the distribution system. The format and coding of these observations are contained in FIG GEN 3.5-26 and FIG GEN 3.5-27.
- Automated Weather Observing System (AWOS)
- Automated weather reporting systems are increasingly being installed at airports. These systems consist of various sensors, a processor, a computer-generated voice subsystem, and a transmitter to broadcast local, minute-by-minute weather data directly to the pilot.
- The AWOS observations will include the prefix “AUTO” to indicate that the data are derived from an automated system. Some AWOS locations will be augmented by certified observers who will provide weather and obstruction to vision information in the remarks of the report when the reported visibility is less than 3 miles. These sites, along with the hours of augmentation, are published in the Chart Supplement. Augmentation is identified in the observation as “OBSERVER WEATHER.” The AWOS wind speed, direction and gusts, temperature, dew point, and altimeter setting are exactly the same as for manual observations. The AWOS will also report density altitude when it exceeds the field elevation by more than 1,000 feet. The reported visibility is derived from a sensor near the touchdown of the primary instrument runway. The visibility sensor output is converted to a visibility value using a 10-minute harmonic average. The reported sky condition/ceiling is derived from the ceilometer located next to the visibility sensor. The AWOS algorithm integrates the last 30 minutes of ceilometer data to derive cloud layers and heights. This output may also differ from the observer sky condition in that the AWOS is totally dependent upon the cloud advection over the sensor site.
- Referred to as AWOS, these real-time systems are operationally classified into nine basic levels:
- AWOS-A only reports altimeter setting.
- AWOS-AV reports altimeter and visibility;
- AWOS-l usually reports altimeter setting, wind data, temperature, dew point, and density altitude.
- AWOS-2 provides the information provided by AWOS-l, plus visibility.
- AWOS-3 provides the information provided by AWOS-2, plus cloud/ceiling data.
- AWOS- 3P provides reports the same as the AWOS 3 system, plus a precipitation identification sensor.
- AWOS- 3PT reports the same as the AWOS 3P System, plus thunderstorm/lightning reporting capability.
- AWOS- 3T reports the same as AWOS 3 system and includes a thunderstorm/lightning reporting capability.
- AWOS- 4 reports the same as the AWOS 3 system, plus precipitation occurrence, type and accumulation, freezing rain, thunderstorm, and runway surface sensors.
- The information is transmitted over a discrete VHF radio frequency or the voice portion of a local NAVAID. AWOS transmissions on a discrete VHF radio frequency are engineered to be receivable to a maximum of 25 NM from the AWOS site and a maximum altitude of 10,000 feet AGL. At many locations, AWOS signals may be received on the surface of the airport, but local conditions may limit the maximum AWOS reception distance and/or altitude. The system transmits a 20- to 30-second weather message updated each minute. Pilots should monitor the designated frequency for the automated weather broadcast. A description of the broadcast is contained in Paragraph 7.3, Automated Weather Observing System (AWOS) Broadcasts. There is no two-way communication capability. Most AWOS sites also have a dial-up capability so that the minute-by-minute weather messages can be accessed via telephone.
- AWOS information (system level, frequency, phone number) concerning specific locations is published, as the systems become operational, in the Chart Supplement and, where applicable, on published Instrument Approach Procedure (IAP) charts. Selected individual systems may be incorporated into nationwide data collection and dissemination networks in the future.
- AWOS Broadcasts. Computer-generated voice is used in AWOS to automate the broadcast of the minute-by-minute weather observations. In addition, some systems are configured to permit the addition of an operator-generated voice message; e.g., weather remarks, following the automated parameters. The phraseology used generally follows that used for other weather broadcasts. Following are explanations and examples of the exceptions.
- Location and Time. The location/name and the phrase “AUTOMATED WEATHER OBSERVATION” followed by the time are announced.
- If the airport's specific location is included in the airport's name, the airport's name is announced.
- If the airport's specific location is not included in the airport's name, the location is announced followed by the airport's name.
- The word “TEST” is added following “OBSERVATION” when the system is not in commissioned status.
- The phrase “TEMPORARILY INOPERATIVE” is added when the system is inoperative.
- Ceiling and Sky Cover
- Ceiling is announced as either “CEILING” or “INDEFINITE CEILING.” The phrases “MEASURED CEILING” and “ESTIMATED CEILING” are not used. With the exception of indefinite ceilings, all automated ceiling heights are measured.
- The word “CLEAR” is not used in AWOS due to limitations in the height ranges of the sensors. No clouds detected is announced as, “No clouds below XXX” or, in newer systems as, “Clear below XXX” (where XXX is the range limit of the sensor).
- A sensor for determining ceiling and sky cover is not included in some AWOS. In these systems, ceiling and sky cover are not announced. “SKY CONDITION MISSING” is announced only if the system is configured with a ceilometer, and the ceiling and sky cover information is not available.
- Visibility
- The lowest reportable visibility value in AWOS is “less than 1/4.” It is announced as “VISIBILITY LESS THAN ONE QUARTER.”
- A sensor for determining visibility is not included in some AWOSs. In these systems, visibility is not announced. “VISIBILITY MISSING” is announced only if the system is configured with a visibility sensor and visibility information is not available.
- Weather. In the future, some AWOSs are to be configured to determine the occurrence of precipitation. However, the type and intensity may not always be determined. In these systems, the word “PRECIPITATION” will be announced if precipitation is occurring, but the type and intensity are not determined.
- Remarks. If remarks are included in the observation, the word “REMARKS” is announced following the altimeter setting. Remarks are announced in the following order of priority:
- Automated “remarks.”
- Variable visibility.
- Density altitude.
- Manual input remarks. Manual input remarks are prefaced with the phrase “OBSERVER WEATHER.” As a general rule the manual remarks are limited to:
- Type and intensity of precipitation.
- Thunderstorms, intensity (if applicable), and direction.
- Obstructions to vision when the visibility is less than 7 miles.
- If an automated parameter is “missing” and no manual input for that parameter is available, the parameter is announced as “MISSING.” For example, a report with the dew point “missing,” and no manual input available, would be announced as follows:
- “REMARKS” are announced in the following order of priority:
- Automated “REMARKS”:
- Variable visibility.
- Density altitude.
- Manual Input “REMARKS.” As a general rule, the remarks are announced in the same order as the parameters appear in the basic text of the observation.
- Automated “REMARKS”:
- Automated “remarks.”
- Location and Time. The location/name and the phrase “AUTOMATED WEATHER OBSERVATION” followed by the time are announced.
- Automated Surface Observing System (ASOS)/Automated Weather Observing System (AWOS)
- The ASOS/AWOS is the primary surface weather observing system of the U.S. The program to install and operate these systems throughout the U.S. is a joint effort of the NWS, the FAA and the Department of Defense. ASOS/AWOS is designed to support aviation operations and weather forecast activities. The ASOS/AWOS will provide continuous minute‐by‐minute observations and perform the basic observing functions necessary to generate an aviation routine weather report (METAR) and other aviation weather information. The information may be transmitted over a discrete VHF radio frequency or the voice portion of a local NAVAID. ASOS/AWOS transmissions on a discrete VHF radio frequency are engineered to be receivable to a maximum of 25 NM from the ASOS/AWOS site and a maximum altitude of 10,000 feet AGL. At many locations, ASOS/AWOS signals may be received on the surface of the airport, but local conditions may limit the maximum reception distance and/or altitude. While the automated system and the human may differ in their methods of data collection and interpretation, both produce an observation quite similar in form and content. For the “objective” elements such as pressure, ambient temperature, dew point temperature, wind, and precipitation accumulation, both the automated system and the observer use a fixed location and time‐averaging technique. The quantitative differences between the observer and the automated observation of these elements are negligible. For the “subjective” elements, however, observers use a fixed time, spatial averaging technique to describe the visual elements (sky condition, visibility and present weather), while the automated systems use a fixed location, time averaging technique. Although this is a fundamental change, the manual and automated techniques yield remarkably similar results within the limits of their respective capabilities. (See FIG GEN 3.5-26 and FIG GEN 3.5-27, Key to Decode an ASOS/AWOS (METAR) Observation.
- System Description
- The ASOS/AWOS at each airport location consists of these main components:
- Individual weather sensors.
- Data collection and processing units.
- Peripherals and displays.
- The ASOS/AWOS sensors perform the basic function of data acquisition. They continuously sample and measure the ambient environment, derive raw sensor data and make them available to the collection and processing units.
- The ASOS/AWOS at each airport location consists of these main components:
- Every ASOS/AWOS will contain the following basic set of sensors.
- Cloud height indicator (one or possibly three).
- Visibility sensor (one or possibly three).
- Precipitation identification sensor.
- Freezing rain sensor.
- Pressure sensors (two sensors at small airports; three sensors at large airports).
- Ambient temperature/dew point temperature sensor.
- Anemometer (wind direction and speed sensor).
- Rainfall accumulation sensor.
- Automated Lightning Detection and Reporting System (ALDARS) (excluding Alaska and Pacific Island sites).
- The ASOS/AWOS data outlets include:
- Those necessary for on-site airport users.
- National communications networks.
- Computer-generated voice (available through FAA radio broadcast to pilots and dial‐in telephone line).
- A comparison of weather observing programs and the elements observed by each are in TBL GEN 3.5-6, Weather Observing Programs.
- Service Standards. During 1995, a government/industry team worked to comprehensively reassess the requirements for surface observations at the nation's airports. That work resulted in agreement on a set of service standards and the FAA and NWS ASOS sites to which the standards would apply. The term “Service Standards” refers to the level of detail in the weather observation. The service standards consist of four different levels of service (A, B, C, and D) as described below. Specific observational elements included in each service level are listed in TBL GEN 3.5-7, Weather Observation Service Standards.
- Service Level D defines the minimum acceptable level of service. It is a completely automated service in which the ASOS/AWOS observation will constitute the entire observation; i.e., no additional weather information is added by a human observer. This service is referred to as a stand alone D site.
- Service Level C is a service in which the human observer, usually an air traffic controller, augments or adds information to the automated observation. Service Level C also includes backup of ASOS/AWOS elements in the event of an ASOS/AWOS malfunction or an unrepresentative ASOS/AWOS report.
- In backup, the human observer inserts the correct or missing value for the automated ASOS/AWOS elements. This service is provided by air traffic controllers under the Limited Aviation Weather Reporting Station (LAWRS) process, FSS and NWS observers, and, at selected sites, Non-Federal Observation Program observers.
Two categories of airports require detail beyond Service Level C in order to enhance air traffic control efficiency and increase system capacity. Services at these airports are typically provided by contract weather observers, NWS observers, and, at some locations, FSS observers.
- Service Level B is a service in which weather observations consist of all elements provided under Service Level C, plus augmentation of additional data beyond the capability of the ASOS/AWOS. This category of airports includes smaller hubs or airports special in other ways that have worse than average bad weather operations for thunderstorms and/or freezing/frozen precipitation, and/or that are remote airports.
- Service Level A, the highest and most demanding category, includes all the data reported in Service Standard B, plus additional requirements as specified. Service Level A covers major aviation hubs and/or high volume traffic airports with average or worse weather.
TBL GEN 3.5-6Weather Observing Programs Type
ASOS
X
X
X
X
X
X
X
X
X
X
AWOS-A
X
AWOS-A/V
X
X
AWOS-1
X
X
X
X
AWOS-2
X
X
X
X
X
AWOS-3
X
X
X
X
X
X
AWOS-3P
X
X
X
X
X
X
X
AWOS-3T
X
X
X
X
X
X
X
AWOS-3P/T
X
X
X
X
X
X
X
X
AWOS-4
X
X
X
X
X
X
X
X
X
X
X
X
Manual
X
X
X
X
X
X
X
Reference- FAA Order JO 7900.5, Surface Weather Observing, for element reporting.
TBL GEN 3.5-7Weather Observation Service Standards SERVICE LEVEL A
Service LevelA consists of all the elements of Service Levels B, C and D plus the elements listed to the right, if observed.
10 minute longline RVR at precedented sites or additional visibility increments of 1/8, 1/16 and 0
Sector visibility
Variable sky condition
Cloud layers above 12,000 feet and cloud types
Widespread dust, sand and other obscurations
Volcanic eruptionsSERVICE LEVEL B
Service LevelB consists of all the elements of Service Levels C and D plus the elements listed to the right, if observed.
Longline RVR at precedented sites
(may be instantaneous readout)
Freezing drizzle versus freezing rain
Ice pellets
Snow depth & snow increasing rapidly remarks
Thunderstorm and lightning location remarks
Observed significant weather not at the station remarksSERVICE LEVEL C
Service LevelC consists of all the elements of Service LevelD plus augmentation and backup by a human observer or an air traffic control specialist on location nearby. Backup consists of inserting the correct value if the system malfunctions or is unrepresentative. Augmentation consists of adding the elements listed to the right, if observed. During hours that the observing facility is closed, the site reverts to Service Level D.
Thunderstorms
Tornadoes
Hail
Virga
Volcanic ash
Tower visibility
Operationally significant remarks as deemed appropriate by the observerSERVICE LEVEL D
This level of service consists of an ASOS or AWOS continually measuring the atmosphere at a point near the runway. The ASOS or AWOS senses and measures the weather parameters listed to the right.
Wind
Visibility
Precipitation/Obstruction to vision
Cloud height
Sky cover
Temperature
Dew point
Altimeter
8.. Weather Radar Services
- The National Weather Service operates a network of radar sites for detecting coverage, intensity, and movement of precipitation. The network is supplemented by FAA and DoD radar sites in the western sections of the country. Local warning radars augment the network by operating on an as needed basis to support warning and forecast programs.
- Scheduled radar observations are taken hourly and transmitted in alpha-numeric format on weather telecommunications circuits for flight planning purposes. Under certain conditions special radar reports are issued in addition to the hourly transmittals. Data contained in the reports is also collected by the National Meteorological Center and used to prepare hourly national radar summary charts for dissemination on facsimile circuits.
- All En route Flight Advisory Service facilities and many Automated Flight Service Stations have equipment to directly access the radar displays from the individual weather radar sites. Specialists at these locations are trained to interpret the display for pilot briefing and inflight advisory services. The Center Weather Service Units located in the ARTCCs also have access to weather radar displays and provide support to all air traffic facilities within their center's area.
- A clear radar display (no echoes) does not mean that there is no significant weather within the coverage of the radar site. Clouds and fog are not detected by the radar. However, when echoes are present, turbulence can be implied by the intensity of the precipitation, and icing is implied by the presence of the precipitation at temperatures at or below zero degrees Celsius. Used in conjunction with other weather products, radar provides invaluable information for weather avoidance and flight planning.
- Additional information on weather radar products and services can be found in the Aviation Weather Handbook, FAA-H-8083-28.
9.. ATC Inflight Weather Avoidance Assistance
- ATC Radar Weather Display
- ATC radars are able to display areas of precipitation by sending out a beam of radio energy that is reflected back to the radar antenna when it strikes an object or moisture which may be in the form of rain drops, hail, or snow. The larger the object is, or the more dense its reflective surface, the stronger the return will be presented. Radar weather processors indicate the intensity of reflective returns in terms of decibels (dBZ). ATC systems cannot detect the presence or absence of clouds. The ATC systems can often determine the intensity of a precipitation area, but the specific character of that area (snow, rain, hail, VIRGA, etc.) cannot be determined. For this reason, ATC refers to all weather areas displayed on ATC radar scopes as “precipitation.”
- All ATC facilities using radar weather processors with the ability to determine precipitation intensity, will describe the intensity to pilots as:
- “LIGHT” (< 26 dBZ)
- “MODERATE” (26 to 40 dBZ)
- “HEAVY” (> 40 to 50 dBZ)
- “EXTREME” (> 50 dBZ)
- ATC facilities that, due to equipment limitations, cannot display the intensity levels of precipitation, will describe the location of the precipitation area by geographic position, or position relative to the aircraft. Since the intensity level is not available, the controller will state “INTENSITY UNKNOWN.”
- ARTCC facilities normally use a Weather and Radar Processor (WARP) to display a mosaic of data obtained from multiple NEXRAD sites. There is a time delay between actual conditions and those displayed to the controller. For example, the precipitation data on the ARTCC controller's display could be up to 6 minutes old. When the WARP is not available, a second system, the narrowband Air Route Surveillance Radar (ARSR) can display two distinct levels of precipitation intensity that will be described to pilots as “MODERATE” (26 to 40 dBZ) and “HEAVY TO EXTREME” ( > 40 dBZ ). The WARP processor is only used in ARTCC facilities.
- ATC radar is not able to detect turbulence. Generally, turbulence can be expected to occur as the rate of rainfall or intensity of precipitation increases. Turbulence associated with greater rates of rainfall/precipitation will normally be more severe than any associated with lesser rates of rainfall/precipitation. Turbulence should be expected to occur near convective activity, even in clear air. Thunderstorms are a form of convective activity that imply severe or greater turbulence. Operation within 20 miles of thunderstorms should be approached with great caution, as the severity of turbulence can be markedly greater than the precipitation intensity might indicate.
- Weather Avoidance Assistance
- To the extent possible, controllers will issue pertinent information of weather or chaff areas and assist pilots in avoiding such areas if requested. Pilots should respond to a weather advisory by either acknowledging the advisory or by acknowledging the advisory and requesting an alternative course of action as follows:
- Request to deviate off course by statinga heading or degrees, direction of deviation, and approximate number of miles. In this case, when the requested deviation is approved, navigation is at the pilot's prerogative, but must maintain the altitude assigned, and remain within the lateral restrictions issued by ATC.
- An approval for lateral deviation authorizes the pilot to maneuver left or right within the lateral limits specified in the clearance.
- Request a new route to avoid the affected area.
- Request a change of altitude.
- Request radar vectors around the affected areas.
- For obvious reasons of safety, an IFR pilot must not deviate from the course or altitude/flight level without a proper ATC clearance. When weather conditions encountered are so severe that an immediate deviation is determined to be necessary and time will not permit approval by ATC, the pilot's emergency authority may be exercised.
- When the pilot requests clearance for a route deviation or for an ATC radar vector, the controller must evaluate the air traffic picture in the affected area and coordinate with other controllers (if ATC jurisdictional boundaries may be crossed) before replying to the request.
- It should be remembered that the controller's primary function is to provide safe separation between aircraft. Any additional service, such as weather avoidance assistance, can only be provided to the extent that it does not derogate the primary function. It is also worth noting that the separation workload is generally greater than normal when weather disrupts the usual flow of traffic. ATC radar limitations and frequency congestion may also be factors in limiting the controller's capability to provide additional service.
- It is very important that the request for deviation or radar vector be forwarded to ATC as far in advance as possible. Delay in submitting it may delay or even preclude ATC approval or require that additional restrictions be placed on the clearance. Insofar as possible, the following information should be furnished to ATC when requesting clearance to detour around weather activity:
- Proposed point where detour will commence.
- Proposed route and extent of detour (direction and distance).
- Point where original route will be resumed.
- Flight conditions (IFR or VFR).
- Any further deviation that may become necessary as the flight progresses.
- Advise if the aircraft is equipped with functioning airborne radar.
- To a large degree, the assistance that might be rendered by ATC will depend upon the weather information available to controllers. Due to the extremely transitory nature of severe weather situations, the controller's weather information may be of only limited value if based on weather observed on radar only. Frequent updates by pilots giving specific information as to the area affected, altitudes, intensity, and nature of the severe weather can be of considerable value. Such reports are relayed by radio or phone to other pilots and controllers, and they also receive widespread teletypewriter dissemination.
- Obtaining IFR clearance or an ATC radar vector to circumnavigate severe weather can often be accommodated more readily in the en route areas away from terminals because there is usually less congestion and, therefore, greater freedom of action. In terminal areas, the problem is more acute because of traffic density, ATC coordination requirements, complex departure and arrival routes, and adjacent airports. As a consequence, controllers are less likely to be able to accommodate all requests for weather detours in a terminal area or be in a position to volunteer such routes to the pilot. Nevertheless, pilots should not hesitate to advise controllers of any observed severe weather and should specifically advise controllers if they desire circumnavigation of observed weather.
- To the extent possible, controllers will issue pertinent information of weather or chaff areas and assist pilots in avoiding such areas if requested. Pilots should respond to a weather advisory by either acknowledging the advisory or by acknowledging the advisory and requesting an alternative course of action as follows:
- ATC Severe Weather Avoidance Plans
- Air Route Traffic Control Centers and some Terminal Radar Control facilities utilize plans for severe weather avoidance within their control areas. Aviation-oriented meteorologists provide weather information. Preplanned alternate route packages developed by the facilities are used in conjunction with flow restrictions to ensure a more orderly flow of traffic during periods of severe or adverse weather conditions.
- During these periods, pilots may expect to receive alternative route clearances. These routes are predicated upon the forecasts of the meteorologist and coordination between the Air Traffic Control System Command Center and the other centers. The routes are utilized as necessary in order to allow as many aircraft as possible to operate in any given area, and frequently they will deviate from the normal preferred routes. With user cooperation, this plan may significantly reduce delays.
- Procedures for Weather Deviations and Other Contingencies in Oceanic Controlled Airspace
- See ENR 7.3, paragraph 4, Weather Deviation Procedures.
10. . Notifications Required From Operators
- Preflight briefing and flight documentation services provided by FSSs do not require prior notification.
- Preflight briefing and flight documentation services provided by a National Weather Service Office (or contract office) are available upon request for long-range international flights for which meteorological data packages are prepared for the pilot-in-command. Briefing times should be coordinated between the local representative and the local meteorological office.
- Flight Service Stations do not normally have the capability to prepare meteorological data packages for a preflight briefing.
11. . Weather Observing Systems and Operating Procedures
For surface wind readings, most meteorological reporting stations have a direct reading, 3-cup anemometer wind system for which a 1-minute mean wind speed and direction (based on true north) is taken. Some stations also have a continuous wind speed recorder which is used in determining the gustiness of the wind.
12. . Runway Visual Range (RVR)
There are currently two configurations of the RVR, commonly identified as Taskers and New Generation RVR. The Taskers use transmissometer technology. The New Generation RVRs use forward scatter technology and are currently being deployed to replace the existing Taskers.
- RVR values are measured by transmissometers mounted on 14-foot towers along the runway. A full RVR system consists of:
- A transmissometer projector and related items.
- A transmissometer receiver (detector) and related items.
- An analog recorder.
- A signal data converter and related items.
- A remote digital or remote display programmer.
- The transmissometer projector and receiver are mounted on towers 250 feet apart. A known intensity of light is emitted from the projector and is measured by the receiver. Any obscuring matter, such as rain, snow, dust, fog, haze, or smoke, reduces the light intensity arriving at the receiver. The resultant intensity measurement is then converted to an RVR value by the signal data converter. These values are displayed by readout equipment in the associated air traffic facility and updated approximately once every minute for controller issuance to pilots.
- The signal data converter receives information on the high-intensity runway edge light setting in use (step 3, 4, or 5), transmission values from the transmissometer, and the sensing of day or night conditions. From the three data sources, the system will compute appropriate RVR values.
- An RVR transmissometer established on a 250-foot baseline provides digital readouts to a minimum of 600 feet, which are displayed in 200-foot increments to 3,000 feet, and in 500-foot increments from 3,000 feet to a maximum value of 6,000 feet.
- RVR values for Category IIIa operations extend down to 700-foot RVR; however, only 600 and 800 feet are reportable RVR increments. The 800 RVR reportable value covers a range of 701 feet to 900 feet and is therefore a valid minimum indication of Category IIIa operations.
- Approach categories with the corresponding minimum RVR values are listed in TBL GEN 3.5-8.
TBL GEN 3.5-8 Category
Visibility (RVR)
Nonprecision
2,400 feet
Category I
1,800 feet*
Category II
1,000 feet
Category IIIa
700 feet
Category IIIb
150 feet
Category IIIc
0 feet
* 1,400 feet with special equipment and authorization
- Ten-minute maximum and minimum RVR values for the designated RVR runway are reported in the body of the aviation weather report when the prevailing visibility is less than 1 mile and/or the RVR is 6,000 feet or less. ATCTs report RVR when the prevailing visibility is 1 mile or less and/or the RVR is 6,000 feet or less.
- Details on the requirements for the operational use of RVR are contained in FAA Advisory Circular 97-1, “Runway Visual Range (RVR).” Pilots are responsible for compliance with minimums prescribed for their class of operations in appropriate Federal Aviation Regulations and/or operations specifications.
- RVR values are also measured by forward scatter meters mounted on 14-foot frangible fiberglass poles. A full RVR system consists of:
- Forward scatter meter with a transmitter, receiver and associated items.
- A runway light intensity monitor (RLIM).
- An ambient light sensor (ALS).
- A data processor unit (DPU).
- A controller display (CD).
- The forward scatter meter is mounted on a 14-foot frangible pole. Infrared light is emitted from the transmitter and received by the receiver. Any obscuring matter such as rain, snow, dust, fog, haze, or smoke increases the amount of scattered light reaching the receiver. The resulting measurement along with inputs from the runway light intensity monitor and the ambient light sensor are forwarded to the DPU which calculates the proper RVR value. The RVR values are displayed locally and remotely on controller displays.
- The runway light intensity monitors both the runway edge and centerline light step settings (steps 1 through 5). Centerline light step settings are used for CAT IIIb operations. Edge light step settings are used for CAT I, II, and IIIa operations.
- New Generation RVRs can measure and display RVR values down to the lowest limits of Category IIIb operations (150 foot RVR). RVR values are displayed in 100-foot increments and are reported as follows:
- 100-foot increments for products below 800 feet.
- 200-foot increments for products between 800 feet and 3,000 feet.
- 500-foot increments for products between 3,000 feet and 6,500 feet.
- 25-meter increments for products below 150 meters.
- 50-meter increments for products between 150 meters and 800 meters.
- 100-meter increments for products between 800 meters and 1,200 meters.
- 200-meter increments for products between 1,200 meters and 2,000 meters.
- RVR values are also measured by forward scatter meters mounted on 14-foot frangible fiberglass poles. A full RVR system consists of:
13. . Reporting of Cloud Heights
- Ceiling, by definition in Federal Aviation Regulations, and as used in Aviation Weather Reports and Forecasts, is the height above ground (or water) level of the lowest layer of clouds or obscuring phenomenon that is reported as “broken,” “overcast,” or “the vertical visibility into an obscuration.” For example, an aerodrome forecast which reads “BKN030” refers to heights above ground level (AGL). An area forecast which reads “BKN030” states that the height is above mean sea level (MSL). See FIG GEN 3.5-24 for the Key to Routine Aviation Weather Reports and Forecasts for the definition of “broken,” “overcast,” and “obscuration.”
- Information on cloud base height is obtained by use of ceilometers (rotating or fixed beam), ceiling lights, ceiling balloons, pilot reports, and observer estimations. The systems in use by most reporting stations are either the observer estimation or the rotating beam ceilometer.
- Pilots usually report height values above mean sea level, since they determine heights by the altimeter. This is taken into account when disseminating and otherwise applying information received from pilots. (“Ceiling” heights are always above ground level.) In reports disseminated as pilot reports, height references are given the same as received from pilots; that is, above mean sea level.
- In area forecasts or inflight Advisories, ceilings are denoted by the contraction “CIG” when used with sky cover symbols as in “LWRG TO CIG OVC005,” or the contraction “AGL” after the forecast cloud height value. When the cloud base is given in height above mean sea level, it is so indicated by the contraction “MSL” or “ASL” following the height value. The heights of cloud tops, freezing level, icing, and turbulence are always given in heights above mean sea level (ASL or MSL).
14. . Reporting Prevailing Visibility
- Surface (horizontal) visibility is reported in METAR reports in terms of statute miles and increments thereof; e.g., 1/16, 1/8, 3/16, 1/4, 5/16, 3/8, 1/2, 5/8, 3/4, 7/8, 1, 1 1/8, etc. (Visibility reported by an unaugmented automated site is reported differently than in a manual report; i.e., ASOS/AWOS: 0, 1/16, 1/8, 1/4, 1/2, 3/4, 1, 1 1/4, 1 1/2, 1 3/4, 2, 2 1/2, 3, 4, 5, etc., AWOS: M1/4, 1/4, 1/2, 3/4, 1, 1 1/4, 1 1/2, 1 3/4, 2, 2 1/2, 3, 4, 5, etc.) Visibility is determined through the ability to see and identify preselected and prominent objects at a known distance from the usual point of observation. Visibilities which are determined to be less than 7 miles, identify the obscuring atmospheric condition; e.g., fog, haze, smoke, etc., or combinations thereof.
- Prevailing visibility is the greatest visibility equaled or exceeded throughout at least one-half the horizon circle, not necessarily contiguous. Segments of the horizon circle which may have a significantly different visibility may be reported in the remarks section of the weather report; i.e., the southeastern quadrant of the horizon circle may be determined to be 2 miles in mist while the remaining quadrants are determined to be 3 miles in mist.
- When the prevailing visibility at the usual point of observation, or at the tower level, is less than 4 miles, certificated tower personnel will take visibility observations in addition to those taken at the usual point of observation. The lower of these two values will be used as the prevailing visibility for aircraft operations.
15. . Estimating Intensity of Rain and Ice Pellets
- Rain
- Light. From scattered drops that, regardless of duration, do not completely wet an exposed surface up to a condition where individual drops are easily seen.
- Moderate. Individual drops are not clearly identifiable; spray is observable just above pavements and other hard surfaces.
- Heavy. Rain seemingly falls in sheets; individual drops are not identifiable; heavy spray to a height of several inches is observed over hard surfaces.
- Ice Pellets
- Light. Scattered pellets that do not completely cover an exposed surface regardless of duration. Visibility is not affected.
- Moderate. Slow accumulation on the ground. Visibility is reduced by ice pellets to less than 7 statute miles.
- Heavy. Rapid accumulation on the ground. Visibility is reduced by ice pellets to less than 3 statute miles.
16. . Estimating the Intensity of Snow or Drizzle (Based on Visibility)
- Light. Visibility more than 1/2 statute mile.
- Moderate. Visibility from more than 1/4 statute mile to 1/2 statute mile.
- Heavy. Visibility 1/4 statute mile or less.
17. . Pilot Weather Reports (PIREPs)
- FAA air traffic facilities are required to solicit PIREPs when the following conditions are reported or forecast: ceilings at or below 5,000 feet, visibility at or below 5 miles (surface or aloft), thunderstorms and related phenomena, icing of a light degree or greater, turbulence of a moderate degree or greater, wind shear, and reported or forecast volcanic ash clouds, including the presence of sulphur gases (SO2 or H2S). SO2 is identifiable as the sharp, acrid odor of a freshly struck match. H2S, also known as sewer gas, has the odor of rotten eggs. Electrical smoke and fire and SO2 are two odors described as somewhat similar.
- Pilots are urged to cooperate and promptly volunteer reports of these conditions and other atmospheric data, such as cloud bases, tops and layers, flight visibility, precipitation, visibility restrictions (haze, smoke, and dust), wind at altitude, and temperature aloft.
- PIREPs should be given to the ground facility with which communications are established; i.e., FSS, ARTCC, or terminal ATC. One of the primary duties of the Inflight position is to serve as a collection point for the exchange of PIREPs with en route aircraft.
- If pilots do not make PIREPs by radio, it is helpful if, upon landing, they report to the nearest FSS or Weather Forecast Office the inflight conditions which they encountered. Some of the uses made of the reports are:
- The ATCT uses the reports to expedite the flow of air traffic in the vicinity of the field and for hazardous weather avoidance procedures.
- The FSS uses the reports to brief other pilots, to provide inflight advisories and weather avoidance information to en route aircraft.
- The ARTCC uses the reports to expedite the flow of en route traffic, to determine most favorable altitudes, and to issue hazardous weather information within the center's area.
- The NWS uses the reports to verify or amend conditions contained in aviation forecasts and advisories; (In some cases, pilot reports of hazardous conditions are the triggering mechanism for the issuance of advisories.)
- The NWS, other government organizations, the military, and private industry groups use PIREPs for research activities in the study of meteorological phenomena.
- All air traffic facilities and the NWS forward the reports received from pilots into the weather distribution system to assure the information is made available to all pilots and other interested parties.
- The FAA, NWS, and other organizations that enter PIREPs into the weather reporting system use the format listed in TBL GEN 3.5-9, PIREP Element Code Chart. Items 1 through 6 are included in all transmitted PIREPs along with one or more of items 7 through 13. Although the PIREP should be as complete and concise as possible, pilots should not be overly concerned with strict format or phraseology. The important thing is that the information is relayed so other pilots may benefit from your observation. If a portion of the report needs clarification, the ground station will request the information.
- Completed PIREPs will be transmitted to weather circuits as in the following examples:
- For more detailed information on PIREPs, users can refer to the current version of the Aviation Weather Handbook, FAA-H-8083-28.
TBL GEN 3.5-9PIREP Element Code Chart PIREP ELEMENT
PIREP CODE
CONTENTS
1.
3-letter station identifier
XXX
Nearest weather reporting location to the reported phenomenon
2.
Report type
UA or UUA
Routine or urgent PIREP
3.
Location
/OV
In relation to a VOR
4.
Time
/TM
Coordinated Universal Time
5.
Altitude
/FL
Essential for turbulence and icing reports
6.
Type aircraft
/TP
Essential for turbulence and icing reports
7.
Sky cover
/SK
Cloud height and coverage (sky clear, few, scattered, broken, or overcast)
8.
Weather
/WX
Flight visibility, precipitation, restrictions to visibility, etc.
9.
Temperature
/TA
Degrees Celsius
10.
Wind
/WV
Direction in degrees magnetic north and speed in knots
11.
Turbulence
/TB
See paragraph 21.
12.
Icing
/IC
See paragraph 19.
13.
Remarks
/RM
For reporting elements not included or to clarify previously reported items
18. . Mandatory MET Points
- Within the ICAO CAR/SAM Regions and within the U.S. area of responsibility, several mandatory MET reporting points have been established. These points are located within the Houston, Miami, and San Juan Flight Information Regions (FIR). These points have been established for flights between the South American and Caribbean Regions and Europe, Canada and the U.S.
- Mandatory MET Reporting Points Within the Houston FIR
Point
For Flights Between
ABBOT
Acapulco and Montreal, New York, Toronto, Mexico City and New Orleans.
ALARD
New Orleans and Belize, Guatemala, San Pedro Sula, Mexico City and Miami, Tampa.
ARGUS
Toronto and Guadalajara, Mexico City, New Orleans and Mexico City.
SWORD
Dallas-Fort Worth, New Orleans, Chicago and Cancun, Cozumel, and Central America.
- Mandatory MET Reporting Points Within the Miami FIR
Point
For Flights Between
Grand Turk
New York and Aruba, Curacao, Kingston, Miami and Belem, St. Thomas, Rio de Janeiro, San Paulo, St. Croix, Kingston and Bermuda.
GRATX
Madrid and Miami, Havana.
MAPYL
New York and Guayaquil, Montego Bay, Panama, Lima, Atlanta and San Juan.
RESIN
New Orleans and San Juan.
SLAPP
New York and Aruba, Curacao, Kingston, Port-au-Prince. Bermuda and Freeport, Nassau. New York and Barranquilla, Bogota, Santo Domingo, Washington and Santo Domingo, Atlanta and San Juan.
- Mandatory MET Reporting Points Within the San Juan FIR
Point
For Flights Between
GRANN
Toronto and Barbados, New York and Fort de France. At intersection of routes A321, A523, G432.
KRAFT
San Juan and Buenos Aires, Caracas, St. Thomas, St. Croix, St. Maarten, San Juan, Kingston and Bermuda.
PISAX
New York and Barbados, Fort de France, Bermuda and Antigua, Barbados.
19. . PIREPs Relating to Airframe Icing
- The effects of ice accretion on aircraft are: cumulative-thrust is reduced, drag increases, lift lessens, weight increases. The results are an increase in stall speed and a deterioration of aircraft performance. In extreme cases, 2 to 3 inches of ice can form on the leading edge of the airfoil in less than 5 minutes. It takes but 1/2 inch of ice to reduce the lifting power of some aircraft by 50 percent and to increase the frictional drag by an equal percentage.
- A pilot can expect icing when flying in visible precipitation, such as rain or cloud droplets, and the temperature is between +02 and -10 degrees Celsius. When icing is detected, a pilot should do one of two things (particularly if the aircraft is not equipped with deicing equipment). The pilot should get out of the area of precipitation or go to an altitude where the temperature is above freezing. This “warmer” altitude may not always be a lower altitude. Proper preflight action includes obtaining information on the freezing level and the above-freezing levels in precipitation areas. Report the icing to an ATC or FSS facility, and if operating IFR, request new routing or altitude if icing will be a hazard. Be sure to give the type of aircraft to ATC when reporting icing. TBL GEN 3.5-10 describes how to report icing conditions.
TBL GEN 3.5-10 Intensity
Ice Accumulation
Trace
Ice becomes noticeable. The rate of accumulation is slightly greater than the rate of sublimation. A representative accretion rate for reference purposes is less than ¼ inch (6 mm) per hour on the outer wing. The pilot should consider exiting the icing conditions before they become worse.
Light
The rate of ice accumulation requires occasional cycling of manual deicing systems to minimize ice accretions on the airframe. A representative accretion rate for reference purposes is ¼ inch to 1 inch (0.6 to 2.5 cm) per hour on the unprotected part of the outer wing. The pilot should consider exiting the icing condition.
Moderate
The rate of ice accumulation requires frequent cycling of manual deicing systems to minimize ice accretions on the airframe. A representative accretion rate for reference purposes is 1 to 3 inches (2.5 to 7.5 cm) per hour on the unprotected part of the outer wing. The pilot should consider exiting the icing condition as soon as possible.
Severe
The rate of ice accumulation is such that ice protection systems fail to remove the accumulation of ice and ice accumulates in locations not normally prone to icing, such as areas aft of protected surfaces and any other areas identified by the manufacturer. A representative accretion rate for reference purposes is more than 3 inches (7.5 cm) per hour on the unprotected part of the outer wing. By regulation, immediate exit is required.
Pilot Report: Aircraft Identification, Location, Time (UTC), Intensity of Type1, Altitude/FL, Aircraft Type, Indicated Air Speed (IAS), and Outside Air Temperature (OAT)2.
1Rime or Clear Ice: Rime ice is a rough, milky, opaque ice formed by the instantaneous freezing of small supercooled water droplets. Clear ice is a glossy, clear, or translucent ice formed by the relatively slow freezing of large supercooled water droplets.
2The Outside Air Temperature (OAT) should be requested by the FSS or ATC if not included in the PIREP.
NOTE - Severe icing is aircraft dependent, as are the other categories of icing intensity. Severe icing may occur at any ice accumulation rate when the icing rate or ice accumulations exceed the tolerance of the aircraft.
20. . Definitions of Inflight Icing Terms
See TBL GEN 3.5-11, Icing Types, and TBL GEN 3.5-12, Icing Conditions.
Clear Ice |
See Glaze Ice. |
Glaze Ice |
Ice, sometimes clear and smooth, but usually containing some air pockets, which results in a lumpy translucent appearance. Glaze ice results from supercooled drops/droplets striking a surface but not freezing rapidly on contact. Glaze ice is denser, harder, and sometimes more transparent than rime ice. Factors, which favor glaze formation, are those that favor slow dissipation of the heat of fusion (i.e., slight supercooling and rapid accretion). With larger accretions, the ice shape typically includes “horns” protruding from unprotected leading edge surfaces. It is the ice shape, rather than the clarity or color of the ice, which is most likely to be accurately assessed from the cockpit. The terms “clear” and “glaze” have been used for essentially the same type of ice accretion, although some reserve “clear” for thinner accretions which lack horns and conform to the airfoil. |
Intercycle Ice |
Ice which accumulates on a protected surface between actuation cycles of a deicing system. |
Known or Observed or Detected Ice Accretion |
Actual ice observed visually to be on the aircraft by the flight crew or identified by on-board sensors. |
Mixed Ice |
Simultaneous appearance or a combination of rime and glaze ice characteristics. Since the clarity, color, and shape of the ice will be a mixture of rime and glaze characteristics, accurate identification of mixed ice from the cockpit may be difficult. |
Residual Ice |
Ice which remains on a protected surface immediately after the actuation of a deicing system. |
Rime Ice |
A rough, milky, opaque ice formed by the rapid freezing of supercooled drops/droplets after they strike the aircraft. The rapid freezing results in air being trapped, giving the ice its opaque appearance and making it porous and brittle. Rime ice typically accretes along the stagnation line of an airfoil and is more regular in shape and conformal to the airfoil than glaze ice. It is the ice shape, rather than the clarity or color of the ice, which is most likely to be accurately assessed from the cockpit. |
Runback Ice |
Ice which forms from the freezing or refreezing of water leaving protected surfaces and running back to unprotected surfaces. |
Note- |
Appendix C Icing Conditions |
Appendix C (14 CFR, Part 25 and 29) is the certification icing condition standard for approving ice protection provisions on aircraft. The conditions are specified in terms of altitude, temperature, liquid water content (LWC), representative droplet size (mean effective drop diameter [MED]), and cloud horizontal extent. |
Forecast Icing Conditions |
Environmental conditions expected by a National Weather Service or an FAA-approved weather provider to be conducive to the formation of inflight icing on aircraft. |
Freezing Drizzle (FZDZ) |
Drizzle is precipitation at ground level or aloft in the form of liquid water drops which have diameters less than 0.5 mm and greater than 0.05 mm. Freezing drizzle is drizzle that exists at air temperatures less than 0_C (supercooled), remains in liquid form, and freezes upon contact with objects on the surface or airborne. |
Freezing Precipitation |
Freezing precipitation is freezing rain or freezing drizzle falling through or outside of visible cloud. |
Freezing Rain (FZRA) |
Rain is precipitation at ground level or aloft in the form of liquid water drops which have diameters greater than 0.5 mm. Freezing rain is rain that exists at air temperatures less than 0_C (supercooled), remains in liquid form, and freezes upon contact with objects on the ground or in the air. |
Icing in Cloud |
Icing occurring within visible cloud. Cloud droplets (diameter < 0.05 mm) will be present; freezing drizzle and/or freezing rain may or may not be present. |
Icing in Precipitation |
Icing occurring from an encounter with freezing precipitation, that is, supercooled drops with diameters exceeding 0.05 mm, within or outside of visible cloud. |
Known Icing Conditions |
Atmospheric conditions in which the formation of ice is observed or detected in flight. |
Potential Icing Conditions |
Atmospheric icing conditions that are typically defined by airframe manufacturers relative to temperature and visible moisture that may result in aircraft ice accretion on the ground or in flight. The potential icing conditions are typically defined in the Airplane Flight Manual or in the Airplane Operation Manual. |
Supercooled Drizzle Drops (SCDD) |
Synonymous with freezing drizzle aloft. |
Supercooled Drops or /Droplets |
Water drops/droplets which remain unfrozen at temperatures below 0_C. Supercooled drops are found in clouds, freezing drizzle, and freezing rain in the atmosphere. These drops may impinge and freeze after contact on aircraft surfaces. |
Supercooled Large Drops (SLD) |
Liquid droplets with diameters greater than 0.05 mm at temperatures less than 0_C, i.e., freezing rain or freezing drizzle. |
21. . PIREPs Relating to Turbulence
- When encountering turbulence, pilots are urgently requested to report such conditions to ATC as soon as practicable. PIREPs relating to turbulence should state:
- Aircraft location.
- Time of occurrence in UTC.
- Turbulence intensity.
- Whether the turbulence occurred in or near clouds.
- Aircraft altitude, or flight level.
- Type of aircraft.
- Duration of turbulence.
- Duration and classification of intensity should be made using TBL GEN 3.5-13, Turbulence Reporting Criteria Table.
TBL GEN 3.5-13Turbulence Reporting Criteria Table Intensity
Aircraft Reaction
Reaction inside Aircraft
Reporting Term-Definition
Light
Turbulence that momentarily causes slight, erratic changes in altitude and/or attitude (pitch, roll, yaw). Report as Light Turbulence; 1orTurbulence that causes slight, rapid and somewhat rhythmic bumpiness without appreciable changes in altitude or attitude. Report as Light Chop.
Occupants may feel a slight strain against seat belts or shoulder straps. Unsecured objects may be displaced slightly. Food service may be conducted, and little or no difficulty is encountered in walking.
Occasional-Less than 1/3 of the time.Intermittent-1/3 to 2/3.Continuous-More than 2/3.
Moderate
Turbulence that is similar to Light Turbulence but of greater intensity. Changes in altitude and/or attitude occur, but the aircraft remains in positive control at all times. It usually causes variations in indicated airspeed. Report as Moderate Turbulence; 1
or
Turbulence that is similar to Light Chop but of greater intensity. It causes rapid bumps or jolts without appreciable changes in aircraft altitude or attitude. Report as Moderate Chop. 1Occupants feel definite strains against seat belts or shoulder straps. Unsecured objects are dislodged. Food service and walking are difficult.
NOTE1. Pilots should report location(s), time (UTC), intensity, whether in or near clouds, altitude, type of aircraft and, when applicable, duration of turbulence.2. Duration may be based on time between two locations or over a single location. All locations should be readily identifiable.
Severe
Turbulence that causes large, abrupt changes in altitude and/or attitude. It usually causes large variations in indicated airspeed. Aircraft may be momentarily out of control. Report as Severe Turbulence.1
Occupants are forced violently against seat belts or shoulder straps. Unsecured objects are tossed about. Food service and walking are impossible.
EXAMPLES:a. Over Omaha. 1232Z, Moderate Turbulence, in cloud, Flight Level 310, B707.
Extreme
Turbulence in which the aircraft is violently tossed about and is practically impossible to control. It may cause structural damage. Report as Extreme Turbulence. 1
b. From 50 miles south of Albuquerque to 30 miles north of Phoenix, 1210Z to 1250Z, occasional Moderate Chop, Flight Level 330, DC8.
1 High level turbulence (normally above 15,000 feet ASL) not associated with cumuliform cloudiness, including thunderstorms, should be reported as clear air turbulence (CAT) preceded by the appropriate intensity, or light or moderate chop.
22. . Wind Shear PIREPs
- Because unexpected changes in wind speed and direction can be hazardous to aircraft operations at low altitudes on approach to and departing from airports, pilots are urged to promptly volunteer reports to controllers of wind shear conditions they encounter. An advance warning of this information will assist other pilots in avoiding or coping with a wind shear on approach or departure.
- When describing conditions, the use of the terms “negative” or “positive” wind shear should be avoided. PIREPs of negative wind shear on final, intended to describe loss of airspeed and lift, have been interpreted to mean that no wind shear was encountered. The recommended method for wind shear reporting is to state the loss/gain of airspeed and the altitude(s) at which it was encountered.
Pilots using Inertial Navigation Systems should report the wind and altitude both above and below the shear layer.
Pilots who are not able to report wind shear in these specific terms are encouraged to make reports in terms of the effect upon their aircraft.
- Wind Shear Escape
- Pilots should report to ATC when they are performing a wind shear escape maneuver. This report should be made as soon as practicable, but not until aircraft safety and control is assured, which may not be satisfied until the aircraft is clear of the wind shear or microburst. ATC should provide safety alerts and traffic advisories, as appropriate.
- Once the pilot initiates a wind shear escape maneuver, ATC is not responsible for providing approved separation between the aircraft and any other aircraft, airspace, terrain, or obstacle until the pilot reports that the escape procedure is complete and approved separation has been re-established. Pilots should advise ATC that they are resuming the previously assigned clearance or should request an alternate clearance.
23. . Clear Air Turbulence (CAT) PIREPs
- Clear air turbulence (CAT) has become a very serious operational factor to flight operations at all levels and especially to jet traffic flying in excess of 15,000 feet. The best available information on this phenomenon must come from pilots via the PIREP procedures. All pilots encountering CAT conditions are urgently requested to report time, location, and intensity (light, moderate, severe, or extreme) of the element to the FAA facility with which they are maintaining radio contact. If time and conditions permit, elements should be reported according to the standards for other PIREPs and position reports. See TBL GEN 3.5-13, Turbulence Reporting Criteria Table.
24. . Microbursts
- Relatively recent meteorological studies have confirmed the existence of microburst phenomena. Microbursts are small-scale intense downdrafts which, on reaching the surface, spread outward in all directions from the downdraft center. This causes the presence of both vertical and horizontal wind shears that can be extremely hazardous to all types and categories of aircraft, especially at low altitudes. Due to their small size, short life-span, and the fact that they can occur over areas without surface precipitation, microbursts are not easily detectable using conventional weather radar or wind shear alert systems.
- Parent clouds producing microburst activity can be any of the low or middle layer convective cloud types. Note however, that microbursts commonly occur within the heavy rain portion of thunderstorms, and in much weaker, benign-appearing convective cells that have little or no precipitation reaching the ground.
- The life cycle of a microburst as it descends in a convective rain shaft is seen in FIG GEN 3.5-8, Evolution of a Microburst. An important consideration for pilots is the fact that the microburst intensifies for about 5 minutes after it strikes the ground.
- Characteristics of microbursts include:
- Size. The microburst downdraft is typically less than 1 mile in diameter as it descends from the cloud base to about 1,000-3,000 feet above the ground. In the transition zone near the ground, the downdraft changes to a horizontal outflow that can extend to approximately 2 1/2 miles in diameter.
- Intensity. The downdrafts can be as strong as 6,000 feet per minute. Horizontal winds near the surface can be as strong as 45 knots resulting in a 90-knot shear (headwind to tailwind change for a traversing aircraft) across the microburst. These strong horizontal winds occur within a few hundred feet of the ground.
- Visual Signs. Microbursts can be found almost anywhere that there is convective activity. They may be embedded in heavy rain associated with a thunderstorm or in light rain in benign- appearing virga. When there is little or no precipitation at the surface accompanying the microburst, a ring of blowing dust may be the only visual clue of its existence.
- Duration. An individual microburst will seldom last longer than 15 minutes from the time it strikes the ground until dissipation. The horizontal winds continue to increase during the first 5 minutes with the maximum intensity winds lasting approximately 2-4 minutes. Sometimes microbursts are concentrated into a line structure and, under these conditions, activity may continue for as long as 1 hour. Once microburst activity starts, multiple microbursts in the same general area are not uncommon and should be expected.
FIG GEN 3.5-9Microburst Encounter During Takeoff 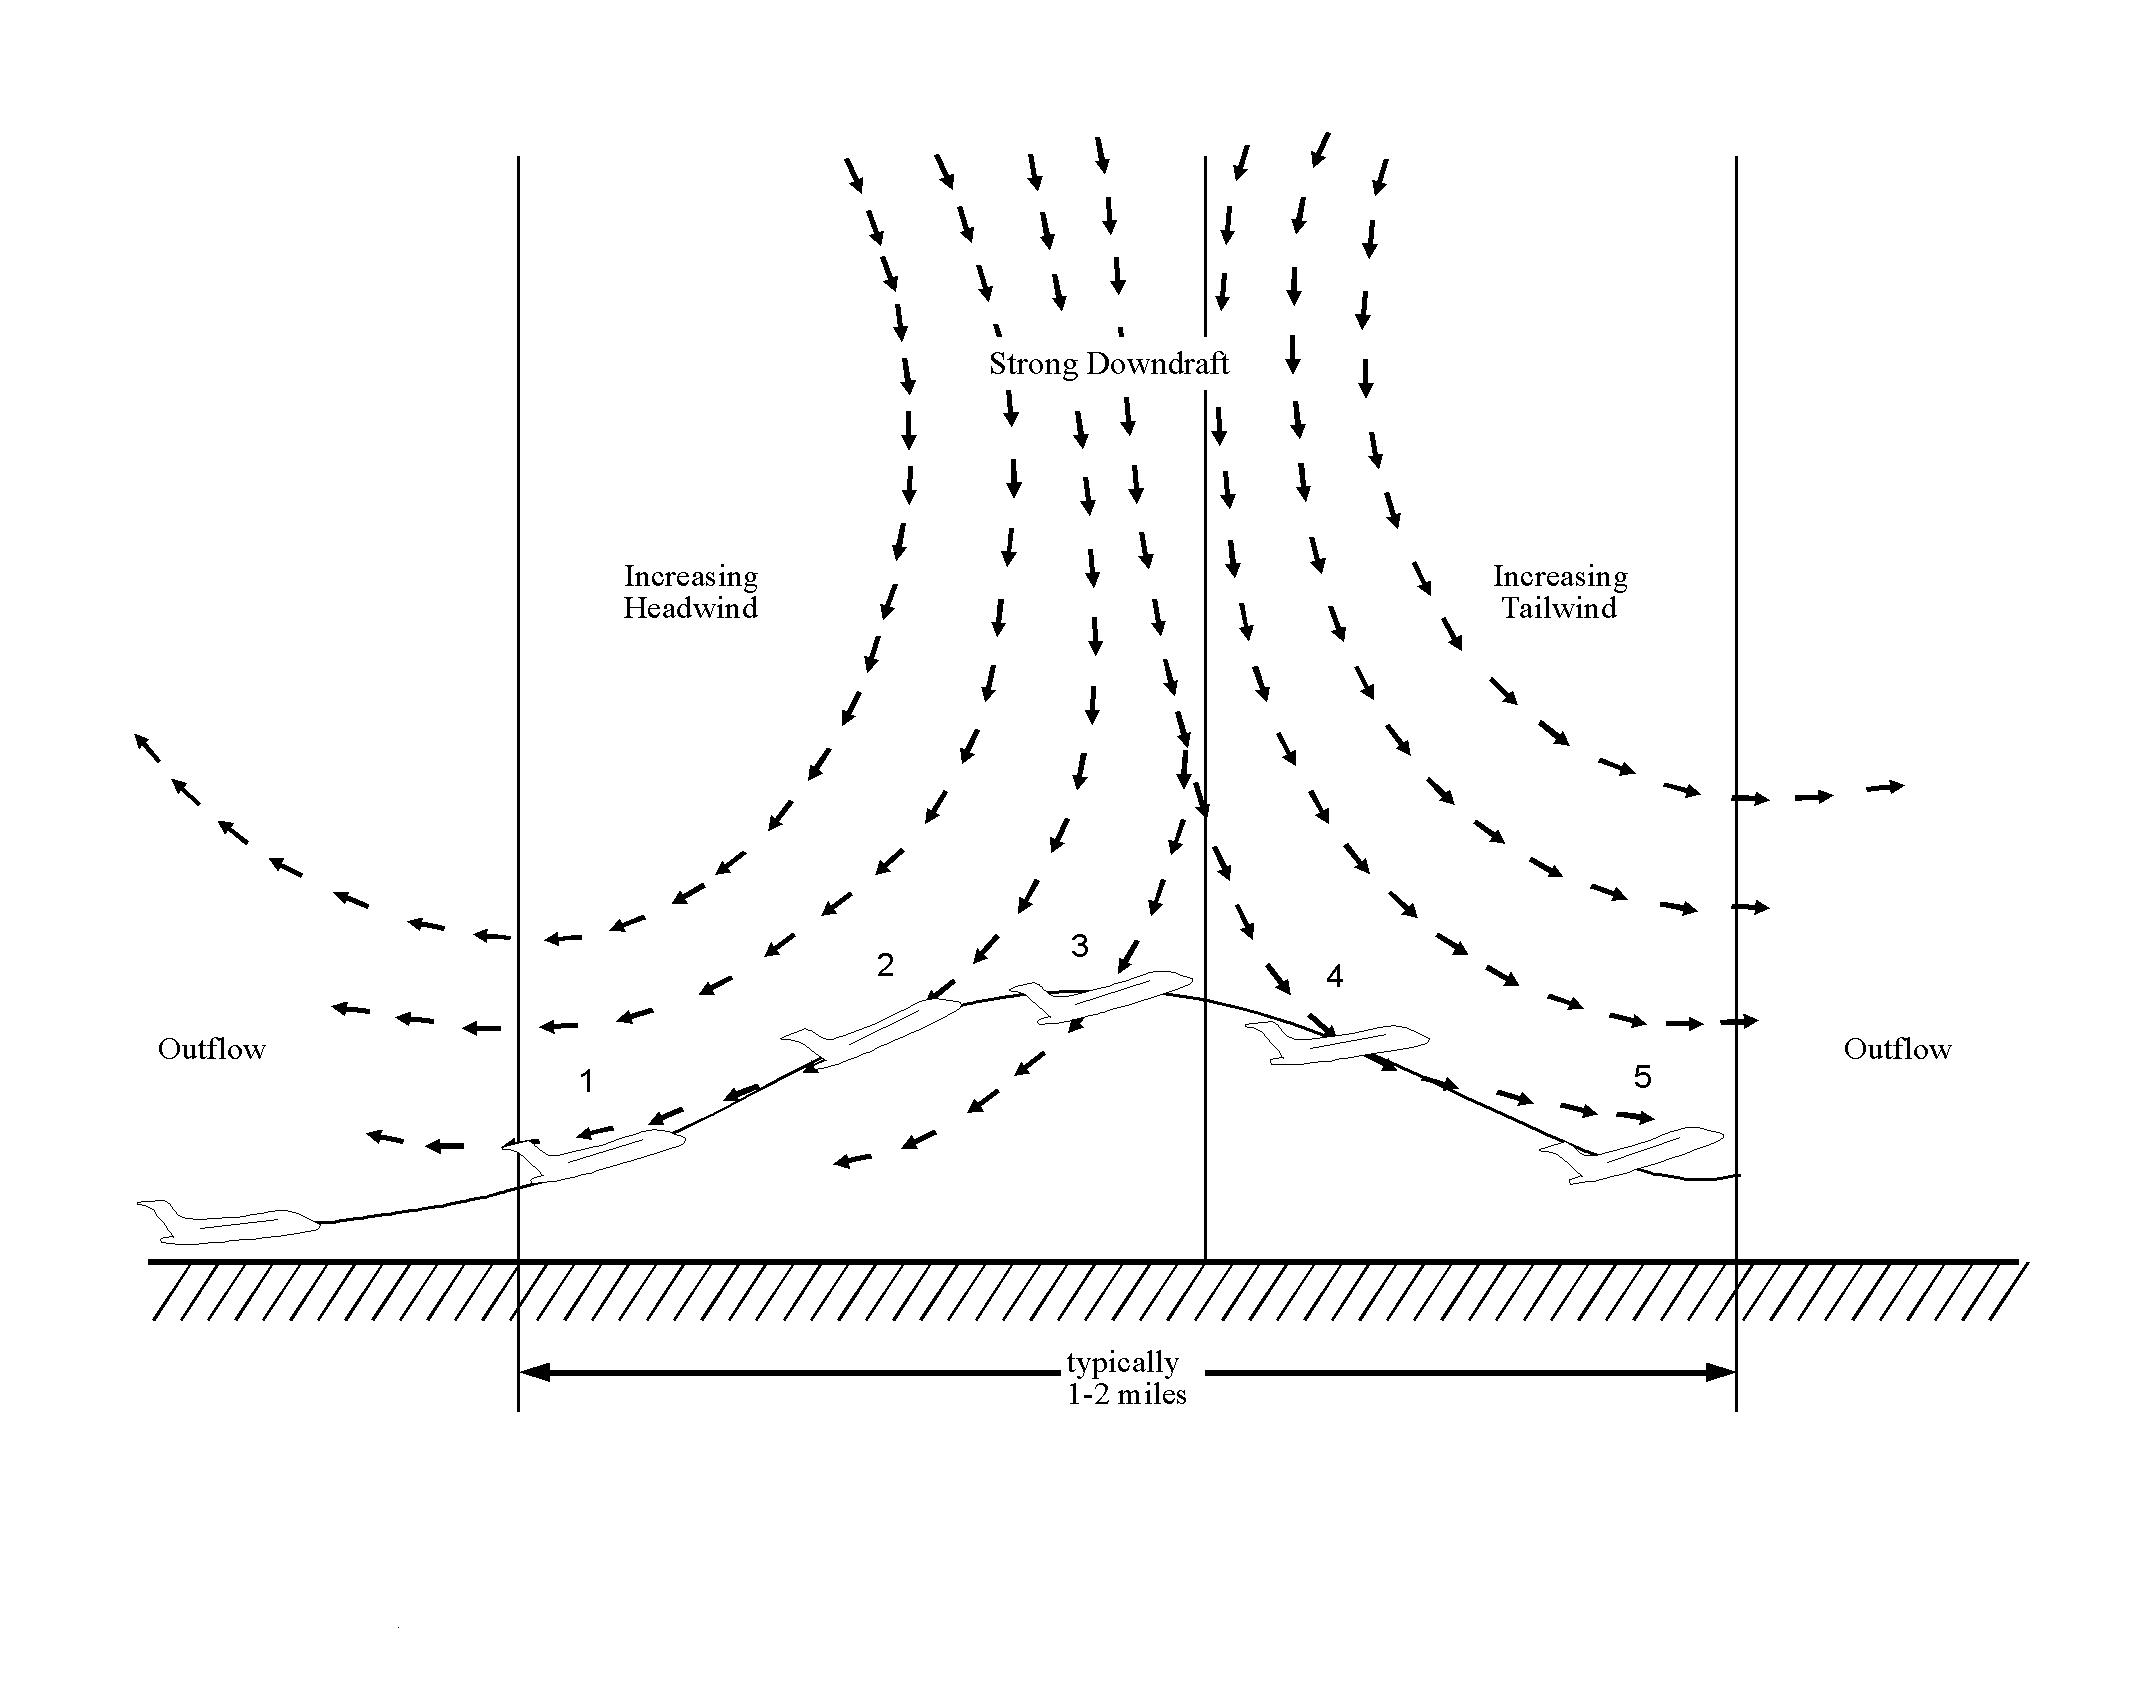
- Microburst wind shear may create a severe hazard for aircraft within 1,000 feet of the ground, particularly during the approach to landing and landing and take-off phases. The impact of a microburst on aircraft which have the unfortunate experience of penetrating one is characterized in FIG GEN 3.5-9. The aircraft may encounter a headwind (performance increasing), followed by a downdraft and a tailwind (both performance decreasing), possibly resulting in terrain impact.
FIG GEN 3.5-10NAS Wind Shear Product Systems 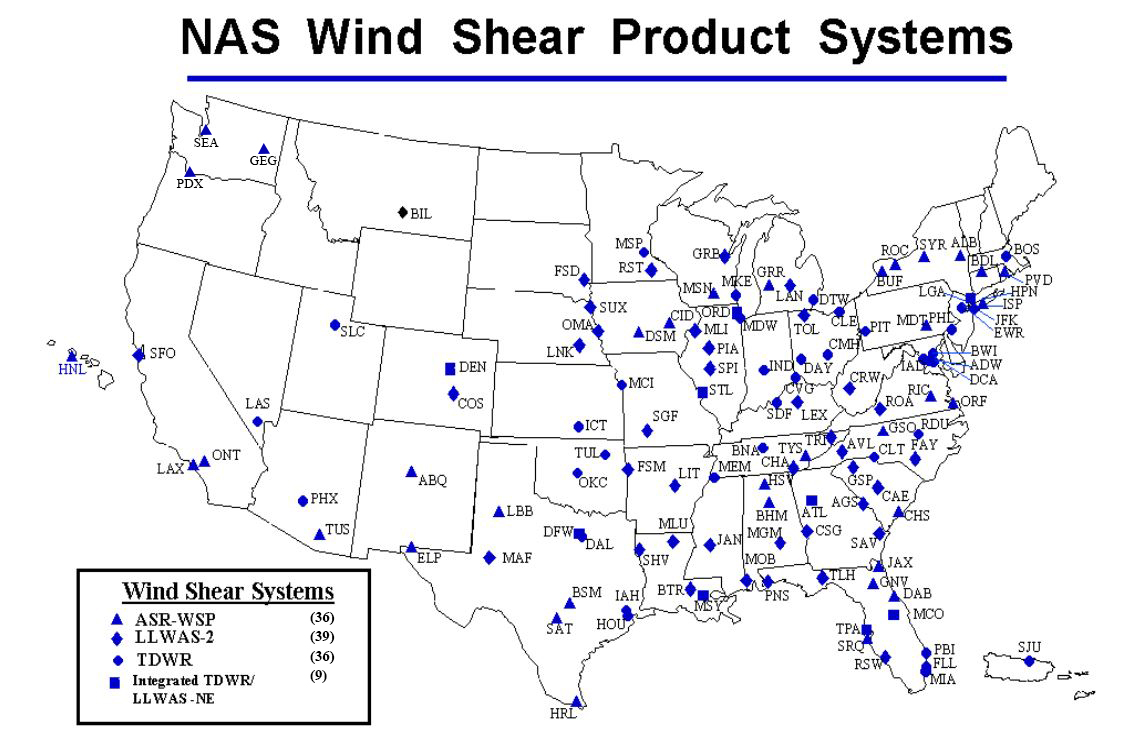
- Detection of Microbursts, Wind Shear, and Gust Fronts
- FAA's Integrated Wind Shear Detection Plan
- The FAA currently employs an integrated plan for wind shear detection that will significantly improve both the safety and capacity of the majority of the airports currently served by the air carriers. This plan integrates several programs, such as the Integrated Terminal Weather System (ITWS), Terminal Doppler Weather Radar (TDWR), Weather System Processor (WSP), and Low Level Wind Shear Alert Systems (LLWAS) into a single strategic concept that significantly improves the aviation weather information in the terminal area. (See FIG GEN 3.5-10.)
- The wind shear/microburst information and warnings are displayed on the ribbon display terminal (RBDT) located in the tower cabs. They are identical (and standardized) to those in the LLWAS, TDWR and WSP systems, and designed so that the controller does not need to interpret the data, but simply read the displayed information to the pilot. The RBDTs are constantly monitored by the controller to ensure the rapid and timely dissemination of any hazardous event(s) to the pilot.
FIG GEN 3.5-11LLWAS Siting Criteria 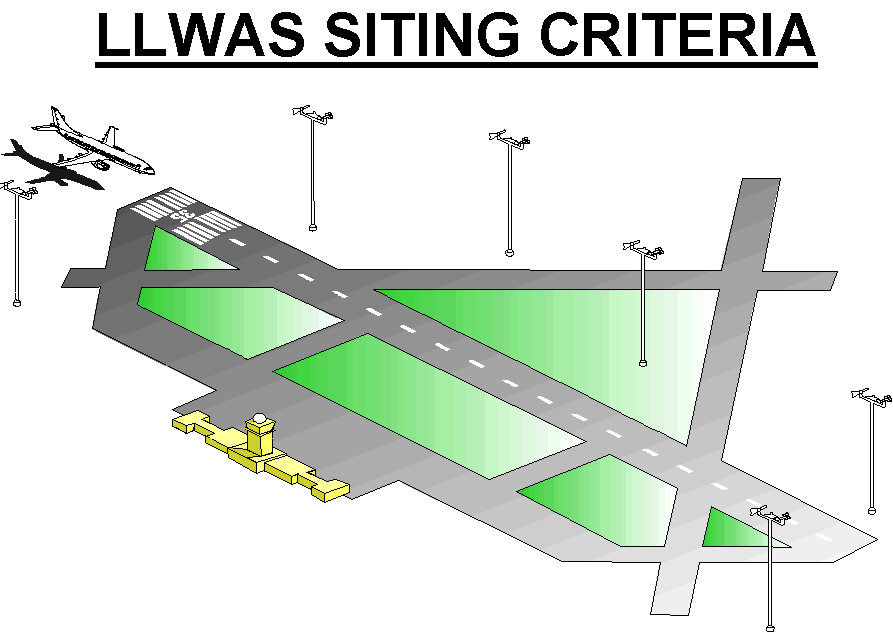
- The early detection of a wind shear/microburst event, and the subsequent warning(s) issued to an aircraft on approach or departure, will alert the pilot/crew to the potential of, and to be prepared for, a situation that could become very dangerous! Without these warnings, the aircraft may NOT be able to climb out of or safely transition the event, resulting in a catastrophe. The air carriers, working with the FAA, have developed specialized training programs using their simulators to train and prepare their pilots on the demanding aircraft procedures required to escape these very dangerous wind shear and/or microburst encounters.
- Low Level Wind Shear Alert System (LLWAS)
- The LLWAS provides wind data and software processes to detect the presence of hazardous wind shear and microbursts in the vicinity of an airport. Wind sensors, mounted on poles sometimes as high as 150 feet, are (ideally) located 2,000 - 3,500 feet, but not more than 5,000 feet, from the centerline of the runway. (See FIG GEN 3.5-11.)
- The LLWAS was fielded in 1988 at 110 airports across the nation. Many of these systems have been replaced by new Terminal Doppler Weather Radar (TDWR) and Weather Systems Processor (WSP) technology. While all legacy LLWAS systems will eventually be phased out, 39 airports will be upgraded to LLWAS-NE (Network Expansion) system. The new LLWAS-NE systems not only provide the controller with wind shear warnings and alerts, including wind shear/microburst detection at the airport wind sensor location, but also provide the location of the hazards relative to the airport runway(s). It also has the flexibility and capability to grow with the airport as new runways are built. As many as 32 sensors, strategically located around the airport and in relationship to its runway configuration, can be accommodated by the LLWAS-NE network.
FIG GEN 3.5-12Warning Boxes 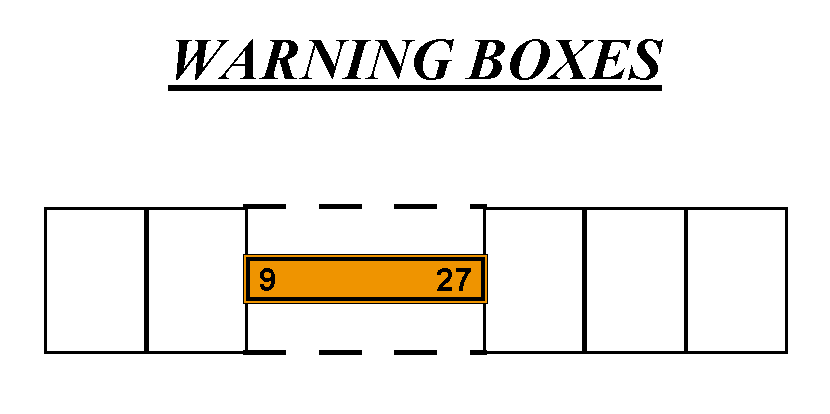
- Terminal Doppler Weather Radar (TDWR)
- TDWRs have been deployed at 45 locations across the U.S. Optimum locations for TDWRs are 8 to 12 miles from the airport proper, and designed to look at the airspace around and over the airport to detect microbursts, gust fronts, wind shifts, and precipitation intensities. TDWR products advise the controller of wind shear and microburst events impacting all runways and the areas1/2mile on either side of the extended centerline of the runways and to a distance of 3 miles on final approach and 2 miles on departure. FIG GEN 3.5-12 is a theoretical view of the runway and the warning boxes that the software uses to determine the location(s) of wind shear or microbursts. These warnings are displayed (as depicted in the examples in subparagraph e) on the ribbon display terminal located in the tower cabs.
- It is very important to understand what TDWR DOES NOT DO:
- It DOES NOT warn of wind shear outside of the alert boxes (on the arrival and departure ends of the runways).
- It DOES NOT detect wind shear that is NOT a microburst or a gust front.
- It DOES NOT detect gusty or cross wind conditions.
- It DOES NOT detect turbulence.
However, research and development is continuing on these systems. Future improvements may include such areas as storm motion (movement), improved gust front detection, storm growth and decay, microburst prediction, and turbulence detection.
- TDWR also provides a geographical situation display (GSD) for supervisors and traffic management specialists for planning purposes. The GSD displays (in color) 6 levels of weather (precipitation), gust fronts and predicted storm movement(s). This data is used by the tower supervisor(s), traffic management specialists, and controllers to plan for runway changes and arrival/departure route changes in order to reduce aircraft delays and increase airport capacity.
- Weather Systems Processor (WSP)
- The WSP provides the controller, supervisor, traffic management specialist, and ultimately the pilot, with the same products as the terminal doppler weather radar at a fraction of the cost. This is accomplished by utilizing new technologies to access the weather channel capabilities of the existing ASR-9 radar located on or near the airport, thus eliminating the requirements for a separate radar location, land acquisition, support facilities, and the associated communication landlines and expenses.
- The WSP utilizes the same RBDT display as the TDWR and LLWAS, and, like the TDWR, has a GSD for planning purposes by supervisors, traffic management specialists, and controllers. The WSP GSD emulates the TDWR display; i.e., it also depicts 6 levels of precipitation, gust fronts and predicted storm movement, and like the TDWR, GSD is used to plan for runway changes and arrival/departure route changes in order to reduce aircraft delays and to increase airport capacity.
- This system is installed at 34 airports across the nation, substantially increasing the safety of flying.
- Operational Aspects of LLWAS, TDWR, and WSP
To demonstrate how this data is used by both the controller and the pilot, 3 ribbon display examples and their explanations are presented:
- MICROBURST ALERTS
27A MBA 35K- 2MF 250 20
This is what the controller will say when issuing the alert.
RUNWAY 27 ARRIVAL, MICROBURST ALERT, 35 KT LOSS 2 MILE FINAL, THRESHOLD WINDS 250 AT 20.
In plain language, the controller is telling the pilot that on approach to runway 27, there is a microburst alert on the approach lane to the runway, and to anticipate or expect a 35-knot loss of airspeed at approximately 2 miles out on final approach (where the aircraft will first encounter the phenomena). With that information, the aircrew is forewarned, and should be prepared to apply wind shear/microburst escape procedures should they decide to continue the approach. Additionally, the surface winds at the airport for landing runway 27 are reported as 250 degrees at 20 knots.
- WIND SHEAR ALERTS
27A WSA 20K- 3MF 200 15
This is what the controller will say when issuing the alert.
RUNWAY 27 ARRIVAL, WIND SHEAR ALERT, 20 KT LOSS 3 MILE FINAL, THRESHOLD WINDS 200 AT 15.
In plain language, the controller is advising the aircraft arriving on runway 27 that at 3 miles out the pilot should expect to encounter a wind shear condition that will decrease airspeed by 20 knots and possibly the aircraft will encounter turbulence. Additionally, the airport surface winds for landing runway 27 are reported as 200 degrees at 15 knots.
FIG GEN 3.5-13Microburst Alert 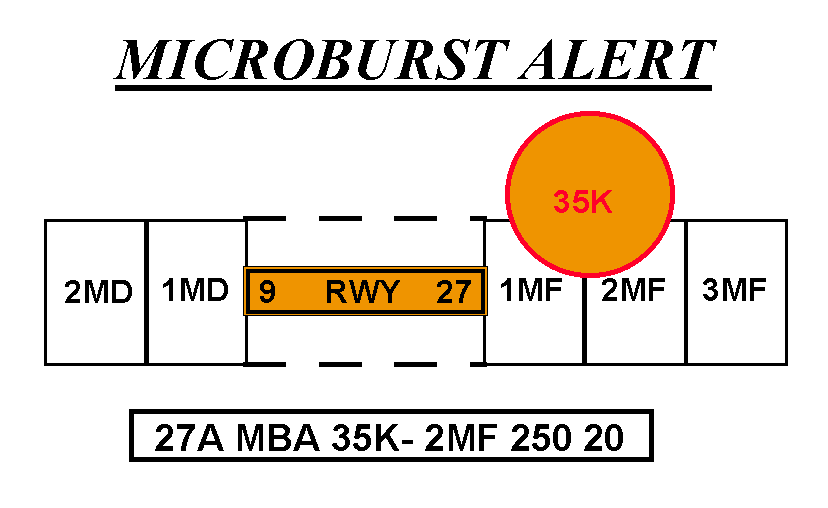
FIG GEN 3.5-14Weak Microburst Alert 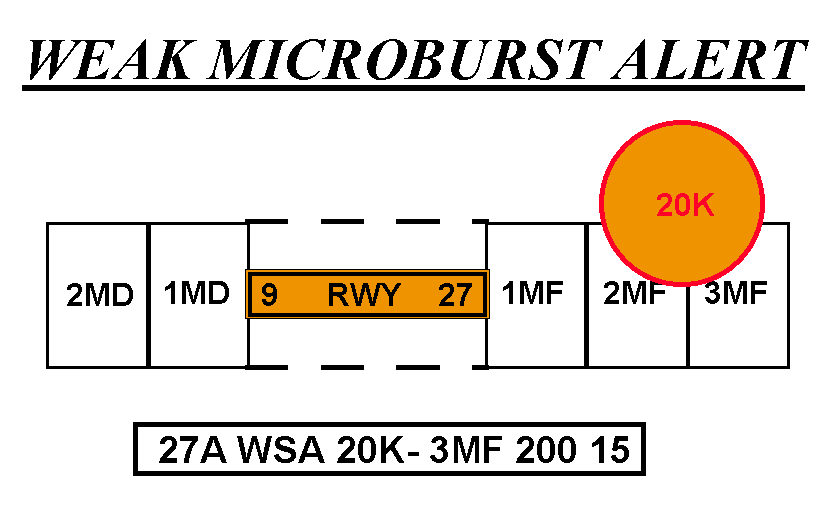
FIG GEN 3.5-15Gust Front Alert 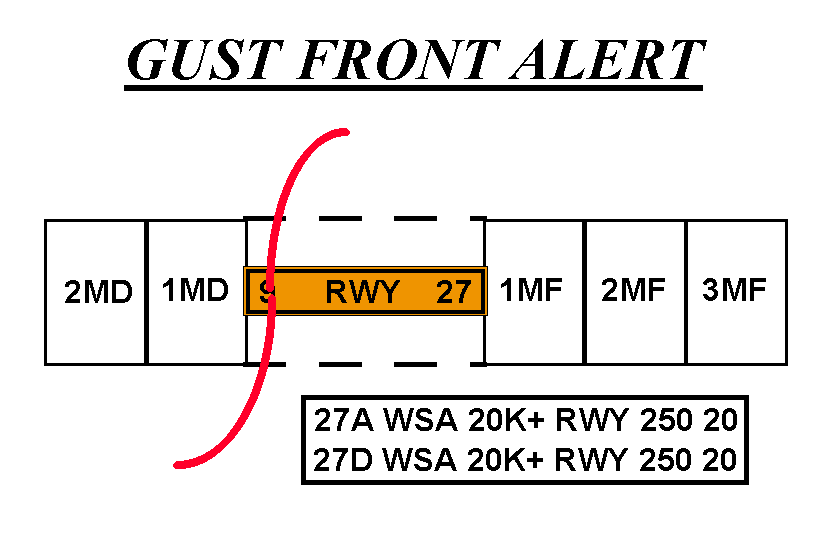
- MULTIPLE WIND SHEAR ALERTS
27A WSA 20K+ RWY 250 20
27D WSA 20K+ RWY 250 20
This is what the controller will say when issuing the alert.
MULTIPLE WIND SHEAR ALERTS.
RUNWAY 27 ARRIVAL, WIND SHEAR ALERT, 20 KT GAIN ON RUNWAY;
RUNWAY 27 DEPARTURE, WIND SHEAR ALERT, 20 KT GAIN ON RUNWAY, WINDS 250 AT 20.
- MICROBURST ALERTS
- The Terminal Weather Information for Pilots System (TWIP)
- With the increase in the quantity and quality of terminal weather information available through TDWR, the next step is to provide this information directly to pilots rather than relying on voice communications from ATC. The National Airspace System (NAS) has long been in need of a means of delivering terminal weather information to the cockpit more efficiently in terms of both speed and accuracy to enhance pilot awareness of weather hazards and reduce air traffic controller workload. With the TWIP capability, terminal weather information, both alphanumerically and graphically, is now available directly to the cockpit for 46 airports in the U.S.NAS. (See FIG GEN 3.5-16.)
FIG GEN 3.5-16TWIP Image of Convective Weather at MCO International 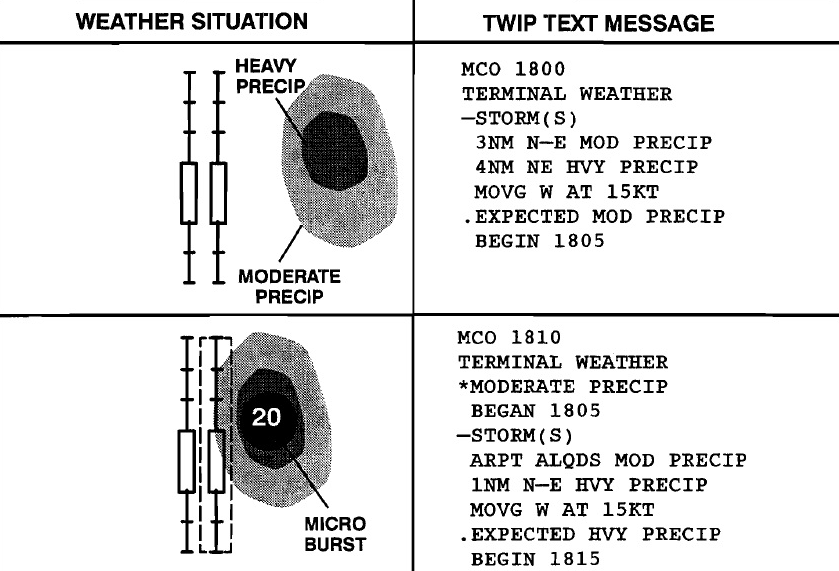
- TWIP products are generated using weather data from the TDWR or the Integrated Terminal Weather System (ITWS). These products can then be accessed by pilots using the Aircraft Communications Addressing and Reporting System (ACARS) data link services. Airline dispatchers can also access this database and send messages to specific aircraft whenever wind shear activity begins or ends at an airport.
- TWIP products include descriptions and character graphics of microburst alerts, wind shear alerts, significant precipitation, convective activity within 30 NM surrounding the terminal area, and expected weather that will impact airport operations. During inclement weather; i.e., whenever a predetermined level of precipitation or wind shear is detected within 15 miles of the terminal area, TWIP products are updated once each minute for text messages and once every 5 minutes for character graphic messages. During good weather (below the predetermined precipitation or wind shear parameters) each message is updated every 10 minutes. These products are intended to improve the situational awareness of the pilot/flight crew, and to aid in flight planning prior to arriving or departing the terminal area. It is important to understand that, in the context of TWIP, the predetermined levels for inclement versus good weather has nothing to do with the criteria for VFR/MVFR/IFR/LIFR; it only deals with precipitation, wind shears, and microbursts.
TBL GEN 3.5-14TWIP-Equipped Airports Airport
Identifier
Andrews AFB, MD
KADW
Hartsfield-Jackson Atlanta Intl Airport
KATL
Nashville Intl Airport
KBNA
Logan Intl Airport
KBOS
Baltimore/Washington Intl Airport
KBWI
Hopkins Intl Airport
KCLE
Charlotte/Douglas Intl Airport
KCLT
Port Columbus Intl Airport
KCMH
Cincinnati/Northern Kentucky Intl Airport
KCVG
Dallas Love Field Airport
KDAL
James M. Cox Intl Airport
KDAY
Ronald Reagan Washington National Airport
KDCA
Denver Intl Airport
KDEN
Dallas-Fort Worth Intl Airport
KDFW
Detroit Metro Wayne County Airport
KDTW
Newark Liberty Intl Airport
KEWR
Fort Lauderdale-Hollywood Intl Airport
KFLL
William P. Hobby Airport
KHOU
Washington Dulles Intl Airport
KIAD
George Bush Intercontinental Airport
KIAH
Wichita Mid-Continent Airport
KICT
Indianapolis Intl Airport
KIND
John F. Kennedy Intl Airport
KJFK
Harry Reid Intl Airport
KLAS
LaGuardia Airport
KLGA
Kansas City Intl Airport
KMCI
Orlando Intl Airport
KMCO
Midway Intl Airport
KMDW
Memphis Intl Airport
KMEM
Miami Intl Airport
KMIA
General Mitchell Intl Airport
KMKE
Minneapolis St. Paul Intl Airport
KMSP
Louis Armstrong New Orleans Intl Airport
KMSY
Will Rogers World Airport
KOKC
O'Hare Intl Airport
KORD
President Donald J. Trump Intl
KDJT
Philadelphia Intl Airport
KPHL
Phoenix Sky Harbor Intl Airport
KPHX
Pittsburgh Intl Airport
KPIT
Raleigh-Durham Intl Airport
KRDU
Louisville Intl Airport
KSDF
Salt Lake City Intl Airport
KSLC
Lambert-St. Louis Intl Airport
KSTL
Tampa Intl Airport
KTPA
Tulsa Intl Airport
KTUL
Luis Munoz Marin Intl Airport
TJSJ
- With the increase in the quantity and quality of terminal weather information available through TDWR, the next step is to provide this information directly to pilots rather than relying on voice communications from ATC. The National Airspace System (NAS) has long been in need of a means of delivering terminal weather information to the cockpit more efficiently in terms of both speed and accuracy to enhance pilot awareness of weather hazards and reduce air traffic controller workload. With the TWIP capability, terminal weather information, both alphanumerically and graphically, is now available directly to the cockpit for 46 airports in the U.S.NAS. (See FIG GEN 3.5-16.)
- FAA's Integrated Wind Shear Detection Plan
25. . PIREPs Relating to Volcanic Ash Activity
- Volcanic eruptions which send ash into the upper atmosphere occur somewhere around the world several times each year. Flying into a volcanic ash cloud can be exceedingly dangerous. At least two B747s have lost all power in all four engines after such an encounter. Regardless of the type aircraft, some damage is almost certain to ensue after an encounter with a volcanic ash cloud. Additionally, studies have shown that volcanic eruptions are the only significant source of large quantities of sulphur dioxide (SO2) gas at jet‐cruising altitudes. Therefore, the detection and subsequent reporting of SO2 is of significant importance. Although SO2 is colorless, its presence in the atmosphere should be suspected when a sulphur‐like or rotten egg odor is present throughout the cabin.
- While some volcanoes in the U.S. are monitored, many in remote areas are not. These unmonitored volcanoes may erupt without prior warning to the aviation community. A pilot observing a volcanic eruption who has not had previous notification of it may be the only witness to the eruption. Pilots are strongly encouraged to transmit a PIREP regarding volcanic eruptions and any observed volcanic ash clouds or detection of sulphur dioxide (SO2) gas associated with volcanic activity.
- Pilots should submit PIREPs regarding volcanic activity using the Volcanic Activity Reporting form (VAR) as illustrated in FIG GEN 3.5-31. (If a VAR form is not immediately available, relay enough information to identify the position and type of volcanic activity.)
- Pilots should verbally transmit the data required in items 1 through 8 of the VAR as soon as possible. The data required in items 9 through 16 of the VAR should be relayed after landing, if possible.
26. . Thunderstorms
- Turbulence, hail, rain, snow, lightning, sustained updrafts and downdrafts, and icing conditions are all present in thunderstorms. While there is some evidence that maximum turbulence exists at the middle level of a thunderstorm, recent studies show little variation of turbulence intensity with altitude.
- There is no useful correlation between the external visual appearance of thunderstorms and the severity or amount of turbulence or hail within them. Also, the visible thunderstorm cloud is only a portion of a turbulent system whose updrafts and downdrafts often extend far beyond the visible storm cloud. Severe turbulence can be expected up to 20 miles from severe thunderstorms. This distance decreases to about 10 miles in less severe storms. These turbulent areas may appear as a well-defined echo on weather radar.
- Weather radar, airborne or ground-based, will normally reflect the areas of moderate to heavy precipitation. (Radar does not detect turbulence.) The frequency and severity of turbulence generally increases with the areas of highest liquid water content of the storm. NO FLIGHT PATH THROUGH AN AREA OF STRONG OR VERY STRONG RADAR ECHOES SEPARATED BY 20-30 MILES OR LESS MAY BE CONSIDERED FREE OF SEVERE TURBULENCE.
- Turbulence beneath a thunderstorm should not be minimized. This is especially true when the relative humidity is low in any layer between the surface and 15,000 feet. Then the lower altitudes may be characterized by strong out-flowing winds and severe turbulence.
- The probability of lightning strikes occurring to aircraft is greatest when operating at altitudes where temperatures are between -5 C and +5 C. Lightning can strike aircraft flying in the clear in the vicinity of a thunderstorm.
- Current weather radar systems are able to objectively determine precipitation intensity. These precipitation intensity areas are described as “light,” “moderate,” “heavy,” and “extreme.”
27. . Thunderstorm Flying
- Thunderstorm Avoidance. Never regard any thunderstorm lightly, even when radar echoes are of light intensity. Avoiding thunderstorms is the best policy. Following are some Do's and Don'ts of thunderstorm avoidance:
- Don't land or takeoff in the face of an approaching thunderstorm. A sudden gust front of low-level turbulence could cause loss of control.
- Don't attempt to fly under a thunderstorm even if you can see through to the other side. Turbulence and wind shear under the storm could be disastrous.
- Don't attempt to fly under the anvil of a thunderstorm. There is a potential for severe and extreme clear air turbulence.
- Don't fly without airborne radar into a cloud mass containing scattered embedded thunderstorms. Scattered thunderstorms not embedded usually can be visually circumnavigated.
- Don't trust the visual appearance to be a reliable indicator of the turbulence inside a thunderstorm.
- Don't assume that ATC will offer radar navigation guidance or deviations around thunderstorms.
- Don't use data‐linked weather next generation weather radar (NEXRAD) mosaic imagery as the sole means for negotiating a path through a thunderstorm area (tactical maneuvering).
- Do remember that the data‐linked NEXRAD mosaic imagery shows where the weather was, not where the weather is. The weather conditions may be 15 to 20 minutes older than the age indicated on the display.
- Do listen to chatter on the ATC frequency for Pilot Weather Reports (PIREP) and other aircraft requesting to deviate or divert.
- Do ask ATC for radar navigation guidance or to approve deviations around thunderstorms, if needed.
- Do use data‐linked weather NEXRAD mosaic imagery (for example, Flight Information Service‐Broadcast (FIS‐B)) for route selection to avoid thunderstorms entirely (strategic maneuvering).
- Do advise ATC, when switched to another controller, that you are deviating for thunderstorms before accepting to rejoin the original route.
- Do ensure that after an authorized weather deviation, before accepting to rejoin the original route, that the route of flight is clear of thunderstorms.
- Do avoid by at least 20 miles any thunderstorm identified as severe or giving an intense radar echo. This is especially true under the anvil of a large cumulonimbus.
- Do circumnavigate the entire area if the area has 6/10 thunderstorm coverage.
- Do remember that vivid and frequent lightning indicates the probability of a severe thunderstorm.
- Do regard as extremely hazardous any thunderstorm with tops 35,000 feet or higher whether the top is visually sighted or determined by radar.
- Do give a PIREP for the flight conditions.
- Do divert and wait out the thunderstorms on the ground if unable to navigate around an area of thunderstorms.
- Do contact Flight Service for assistance in avoiding thunderstorms. Flight Service specialists have NEXRAD mosaic radar imagery and NEXRAD single site radar with unique features such as base and composite reflectivity, echo tops, and VAD wind profiles.
- If you cannot avoid penetrating a thunderstorm, following are some Do's before entering the storm:
- Tighten your safety belt, put on your shoulder harness (if installed), if and secure all loose objects.
- Plan and hold the course to take the aircraft through the storm in a minimum time.
- To avoid the most critical icing, establish a penetration altitude below the freezing level or above the level of -15 C.
- Verify that pitot heat is on and turn on carburetor heat or jet engine anti-ice. Icing can be rapid at any altitude and cause almost instantaneous power failure and/or loss of airspeed indication.
- Establish power settings for turbulence penetration airspeed recommended in your aircraft manual.
- Turn up cockpit lights to highest intensity to lessen danger of temporary blindness from lightning.
- If using automatic pilot, disengage Altitude Hold Mode and Speed Hold Mode. The automatic altitude and speed controls will increase maneuvers of the aircraft thus increasing structural stress.
- If using airborne radar, tilt the antenna up and down occasionally. This will permit the detection of other thunderstorm activity at altitudes other than the one being flown.
- Following are some Do's and Don'ts during the thunderstorm penetration:
- Do keep your eyes on your instruments. Looking outside the cockpit can increase danger of temporary blindness from lightning.
- Don't change power settings; maintain settings for the recommended turbulence penetration airspeed.
- Do maintain constant attitude. Allow the altitude and airspeed to fluctuate.
- Don't turn back once you are in the thunderstorm. A straight course through the storm most likely will get the aircraft out of the hazards most quickly. In addition, turning maneuvers increase stress on the aircraft.
28. . Wake Turbulence
- General
- Every aircraft generates wake turbulence while in flight. Wake turbulence is a function of an aircraft producing lift, resulting in the formation of two counter-rotating vortices trailing behind the aircraft.
- Wake turbulence from the generating aircraft can affect encountering aircraft due to the strength, duration, and direction of the vortices. Wake turbulence can impose rolling moments exceeding the roll-control authority of encountering aircraft, causing possible injury to occupants and damage to aircraft. Pilots should always be aware of the possibility of a wake turbulence encounter when flying through the wake of another aircraft, and adjust the flight path accordingly.
- Vortex Generation
- The creation of a pressure differential over the wing surface generates lift. The lowest pressure occurs over the upper wing surface and the highest pressure under the wing. This pressure differential triggers the roll up of the airflow at the rear of the wing resulting in swirling air masses trailing downstream of the wing tips. After the roll up is completed, the wake consists of two counter-rotating cylindrical vortices. (See FIG GEN 3.5-17.) The wake vortex is formed with most of the energy concentrated within a few feet of the vortex core.
- More aircraft are being manufactured or retrofitted with winglets. There are several types of winglets, but their primary function is to increase fuel efficiency by improving the lift-to-drag ratio. Studies have shown that winglets have a negligible effect on wake turbulence generation, particularly with the slower speeds involved during departures and arrivals.
- Vortex Strength
- Weight, speed, wingspan, and shape of the generating aircraft's wing all govern the strength of the vortex. The vortex characteristics of any given aircraft can also be changed by extension of flaps or other wing configuring devices. However, the vortex strength from an aircraft increases proportionately to an increase in operating weight or a decrease in aircraft speed. Since the turbulence from a “dirty” aircraft configuration hastens wake decay, the greatest vortex strength occurs when the generating aircraft is HEAVY, CLEAN, and SLOW.
- Induced Roll
- In rare instances, a wake encounter could cause catastrophic inflight structural damage to an aircraft. However, the usual hazard is associated with induced rolling moments that can exceed the roll-control authority of the encountering aircraft. During inflight testing, aircraft intentionally flew directly up trailing vortex cores of larger aircraft. These tests demonstrated that the ability of aircraft to counteract the roll imposed by wake vortex depends primarily on the wingspan and counter-control responsiveness of the encountering aircraft. These tests also demonstrated the difficulty of an aircraft to remain within a wake vortex. The natural tendency is for the circulation to eject aircraft from the vortex.
- Counter-control is usually effective and induced roll minimal in cases where the wing span and ailerons of the encountering aircraft extend beyond the rotational flow field of the vortex. It is more difficult for aircraft with short wing span (relative to the generating aircraft) to counter the imposed roll induced by vortex flow. Pilots of short-span aircraft, even of the high-performance type, must be especially alert to vortex encounters. (See FIG GEN 3.5-18.)
- Vortex Behavior
- Trailing vortices have certain behavioral characteristics which can help a pilot visualize the wake location and thereby take avoidance precautions.
- An aircraft generates vortices from the moment it rotates on takeoff to touchdown, since trailing vortices are a by-product of wing lift. Prior to takeoff or touchdown pilots should note the rotation or touchdown point of the preceding aircraft. (See FIG GEN 3.5-19.)
- The vortex circulation is outward, upward and around the wing tips when viewed from either ahead or behind the aircraft. Tests with larger aircraft have shown that the vortices remain spaced a bit less than a wingspan apart, drifting with the wind, at altitudes greater than a wingspan from the ground. In view of this, if persistent vortex turbulence is encountered, a slight change of altitude (upward) and lateral position (upwind) should provide a flight path clear of the turbulence.
- Flight tests have shown that the vortices from larger aircraft sink at a rate of several hundred feet per minute, slowing their descent and diminishing in strength with time and distance behind the generating aircraft. Pilots should fly at or above the preceding aircraft's flight path, altering course as necessary to avoid the area directly behind and below the generating aircraft. (See FIG GEN 3.5-20.) Pilots, in all phases of flight, must remain vigilant of possible wake effects created by other aircraft. Studies have shown that atmospheric turbulence hastens wake breakup, while other atmospheric conditions can transport wake horizontally and vertically.
FIG GEN 3.5-17Wake Vortex Generation 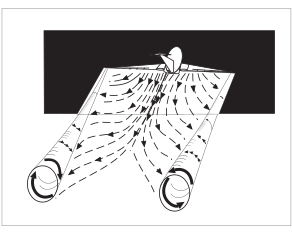
FIG GEN 3.5-18Wake Encounter Counter Control 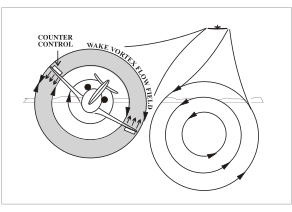
FIG GEN 3.5-19Wake Ends/Wake Begins 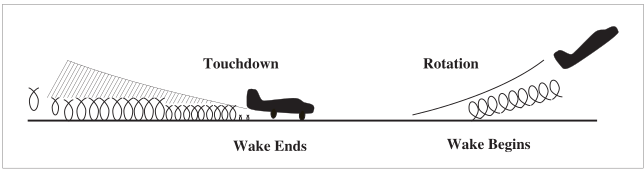
FIG GEN 3.5-20Vortex Flow Field 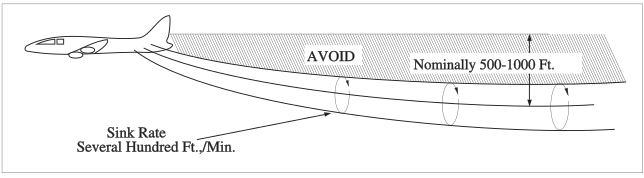
FIG GEN 3.5-21Vortex Movement Near Ground - No Wind 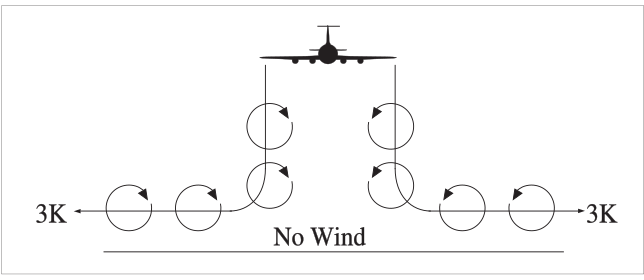
- When the vortices of larger aircraft sink close to the ground (within 100 to 200 feet), they tend to move laterally over the ground at a speed of 2 or 3 knots. (See FIG GEN 3.5-21.)
- Pilots should be alert at all times for possible wake vortex encounters when conducting approach and landing operations. The pilot is ultimately responsible for maintaining an appropriate interval, and should consider all available information in positioning the aircraft in the terminal area, to avoid the wake turbulence created by a preceding aircraft. Test data show that vortices can rise with the air mass in which they are embedded. The effects of wind shear can cause vortex flow field “tilting.” In addition, ambient thermal lifting and orographic effects (rising terrain or tree lines) can cause a vortex flow field to rise and possibly bounce.
FIG GEN 3.5-22Vortex Movement Near Ground - with Cross Winds 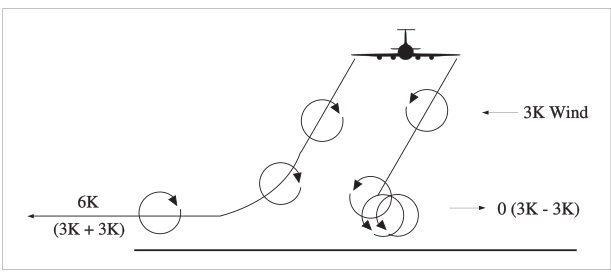
FIG GEN 3.5-23Vortex Movement in Ground Effect - Tailwind 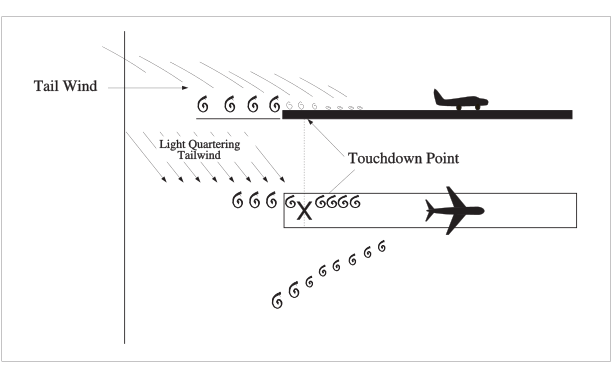
- A crosswind will decrease the lateral movement of the upwind vortex and increase the movement of the downwind vortex. Thus, a light wind with a cross-runway component of 1 to 5 knots could result in the upwind vortex remaining in the touchdown zone for a period of time and hasten the drift of the downwind vortex toward another runway. (See FIG GEN 3.5-22.) Similarly, a tailwind condition can move the vortices of the preceding aircraft forward into the touchdown zone. THE LIGHT QUARTERING TAILWIND REQUIRES MAXIMUM CAUTION. Pilots should be alert to large aircraft upwind from their approach and takeoff flight paths. (See FIG GEN 3.5-23.)
- Trailing vortices have certain behavioral characteristics which can help a pilot visualize the wake location and thereby take avoidance precautions.
- Operations Problem Areas
- A wake turbulence encounter can range from negligible to catastrophic. The impact of the encounter depends on the weight, wingspan, size of the generating aircraft, distance from the generating aircraft, and point of vortex encounter. The probability of induced roll increases when the encountering aircraft's heading is generally aligned with the flight path of the generating aircraft.
- AVOID THE AREA BELOW AND BEHIND THE WAKE GENERATING AIRCRAFT, ESPECIALLY AT LOW ALTITUDE WHERE EVEN A MOMENTARY WAKE ENCOUNTER COULD BE CATASTROPHIC.
- Pilots should be particularly alert in calm wind conditions and situations where the vortices could:
- Remain in the touchdown area.
- Drift from aircraft operating on a nearby runway.
- Sink into the takeoff or landing path from a crossing runway.
- Sink into the traffic pattern from other airport operations.
- Sink into the flight path of VFR aircraft operating on the hemispheric altitude 500 feet below.
- Pilots should attempt to visualize the vortex trail of aircraft whose projected flight path they may encounter. When possible, pilots of larger aircraft should adjust their flight paths to minimize vortex exposure to other aircraft.
- Vortex Avoidance Procedures
- Under certain conditions, airport traffic controllers apply procedures for separating IFR aircraft. If a pilot accepts a clearance to visually follow a preceding aircraft, the pilot accepts responsibility for separation and wake turbulence avoidance. The controllers will also provide to VFR aircraft, with whom they are in communication and which in the tower's opinion may be adversely affected by wake turbulence from a larger aircraft, the position, altitude and direction of flight of larger aircraft followed by the phrase “CAUTION - WAKE TURBULENCE.” After issuing the caution for wake turbulence, the airport traffic controllers generally do not provide additional information to the following aircraft unless the airport traffic controllers know the following aircraft is overtaking the preceding aircraft. WHETHER OR NOT A WARNING OR INFORMATION HAS BEEN GIVEN, HOWEVER, THE PILOT IS EXPECTED TO ADJUST AIRCRAFT OPERATIONS AND FLIGHT PATH AS NECESSARY TO PRECLUDE SERIOUS WAKE ENCOUNTERS. When any doubt exists about maintaining safe separation distances between aircraft during approaches, pilots should ask the control tower for updates on separation distance and aircraft groundspeed.
- The following vortex avoidance procedures are recommended for the various situations:
- Landing Behind a Larger Aircraft - Same Runway. Stay at or above the larger aircraft's final approach flight path - note its touchdown point - land beyond it.
- Landing Behind a Larger Aircraft - When a Parallel Runway is Closer Than 2,500 Feet. Consider possible drift to your runway. Stay at or above the larger aircraft's final approach flight path - note its touchdown point.
- Landing Behind a Larger Aircraft - Crossing Runway. Cross above the larger aircraft's flight path.
- Landing Behind a Departing Larger Aircraft - Same Runway. Note the larger aircraft's rotation point - land well prior to rotation point.
- Landing Behind a Departing Larger Aircraft - Crossing Runway. Note the larger aircraft's rotation point - if past the intersection - continue the approach - land prior to the intersection. If larger aircraft rotates prior to the intersection, avoid flight below the larger aircraft's flight path. Abandon the approach unless a landing is ensured well before reaching the intersection.
- Departing Behind a Larger Aircraft. Note the larger aircraft's rotation point - rotate prior to larger aircraft's rotation point - continue climb above the larger aircraft's climb path until turning clear of the larger aircraft's wake. Avoid subsequent headings which will cross below and behind a larger aircraft. Be alert for any critical takeoff situation which could lead to a vortex encounter.
- Intersection Takeoffs - Same Runway. Be alert to adjacent larger aircraft operations, particularly upwind of your runway. If intersection takeoff clearance is received, avoid subsequent headings which will cross below a larger aircraft's path.
- Departing or Landing After a Larger Aircraft Executing a Low Approach, Missed Approach, Or Touch-and-go Landing. Because vortices settle and move laterally near the ground, the vortex hazard may exist along the runway and in your flight path after a larger aircraft has executed a low approach, missed approach, or a touch-and-go landing, particular in light quartering wind conditions. You should ensure that an interval of at least 2 minutes has elapsed before your takeoff or landing.
- En Route VFR (Thousand-foot Altitude Plus 500 Feet). Avoid flight below and behind a large aircraft's path. If a larger aircraft is observed above on the same track (meeting or overtaking) adjust your position laterally, preferably upwind.
- Helicopters
- In a slow hover-taxi or stationary hover near the surface, helicopter main rotor(s) generate downwash producing high velocity outwash vortices to a distance approximately three times the diameter of the rotor. When rotor downwash hits the surface, the resulting outwash vortices have behavioral characteristics similar to wing tip vortices produced by fixed-wing aircraft. However, the vortex circulation is outward, upward, around, and away from the main rotor(s) in all directions. Pilots of small aircraft should avoid operating within three rotor diameters of any helicopter in a slow hover-taxi or stationary hover. In forward flight, departing or landing helicopters produce a pair of strong, high-speed trailing vortices similar to wing tip vortices of larger fixed-wing aircraft. Pilots of small aircraft should use caution when operating behind or crossing behind landing and departing helicopters.
- Pilot Responsibility
- Research and testing have been conducted, in addition to ongoing wake initiatives, in an attempt to mitigate the effects of wake turbulence. Pilots must exercise vigilance in situations where they are responsible for avoiding wake turbulence.
- Pilots are reminded that in operations conducted behind all aircraft, acceptance of instructions from ATC in the following situations is an acknowledgment that the pilot will ensure safe takeoff and landing intervals and accepts the responsibility of providing his/her own wake turbulence separation:
- Traffic information.
- Instructions to follow an aircraft.
- The acceptance of a visual approach clearance.
- For operations conducted behind super or heavy aircraft, ATC will specify the word “super” or “heavy” as appropriate, when this information is known. Pilots of super or heavy aircraft should always use the word “super” or “heavy” in radio communications.
- Super, heavy and large jet aircraft operators should use the following procedures during an approach to landing. These procedures establish a dependable baseline from which pilots of in-trail, lighter aircraft may reasonably expect to make effective flight path adjustments to avoid serious wake vortex turbulence.
- Pilots of aircraft that produce strong wake vortices should make every attempt to fly on the established glidepath, not above it; or, if glidepath guidance is not available, to fly as closely as possible to a “3-1” glidepath, not above it.
- Pilots of aircraft that produce strong wake vortices should fly as closely as possible to the approach course centerline or to the extended centerline of the runway of intended landing as appropriate to conditions.
- Pilots operating lighter aircraft on visual approaches in-trail to aircraft producing strong wake vortices should use the following procedures to assist in avoiding wake turbulence. These procedures apply only to those aircraft that are on visual approaches.
- Pilots of lighter aircraft should fly on or above the glidepath. Glidepath reference may be furnished by an ILS, by a visual approach slope system, by other ground-based approach slope guidance systems, or by other means. In the absence of visible glidepath guidance, pilots may very nearly duplicate a 3-degree glideslope by adhering to the “3 to 1” glidepath principle.
- If the pilot of the lighter following aircraft has visual contact with the preceding heavier aircraft and also with the runway, the pilot may further adjust for possible wake vortex turbulence by the following practices:
- Pick a point of landing no less than 1,000 feet from the arrival end of the runway.
- Establish a line-of-sight to that landing point that is above and in front of the heavier preceding aircraft.
- When possible, note the point of landing of the heavier preceding aircraft and adjust point of intended landing as necessary.
- Maintain the line-of-sight to the point of intended landing above and ahead of the heavier preceding aircraft; maintain it to touchdown.
- Land beyond the point of landing of the preceding heavier aircraft. Ensure you have adequate runway remaining, if conducting a touch-and-go landing, or adequate stopping distance available for a full stop landing.
- During visual approaches pilots may ask ATC for updates on separation and groundspeed with respect to heavier preceding aircraft, especially when there is any question of safe separation from wake turbulence.
- Pilots should notify ATC when a wake event is encountered. Be as descriptive as possible (i.e., bank angle, altitude deviations, intensity and duration of event, etc.) when reporting the event. ATC will record the event through their reporting system. You are also encouraged to use the Aviation Safety Reporting System (ASRS) to report wake events.
- Air Traffic Wake Turbulence Separations
- Because of the possible effects of wake turbulence, controllers are required to apply no less than minimum required separation to all aircraft operating behind a Super or Heavy, and to Small aircraft operating behind a B757, when aircraft are IFR; VFR and receiving Class B, Class C, or TRSA airspace services; or VFR and being radar sequenced.
- Typical separation applied to aircraft operating directly behind a super or heavy at the same altitude or less than 1,000 feet below, and to small aircraft operating directly behind a B757 at the same altitude or less than 500 feet below:
- Heavy behind super - 5 miles.
- Large behind super - 7 miles.
- Small behind super - 8 miles.
- Heavy behind heavy - 3 miles.
- Small/large behind heavy - 5 miles.
- Small behind B757 - 4 miles.
- Also, separation, measured at the time the preceding aircraft is over the landing threshold, is provided to small aircraft:
- Small landing behind heavy - 6 miles.
- Small landing behind large, non-B757 - 4 miles.
- Typical separation applied to aircraft operating directly behind a super or heavy at the same altitude or less than 1,000 feet below, and to small aircraft operating directly behind a B757 at the same altitude or less than 500 feet below:
- Additionally, appropriate time or distance intervals are provided to departing aircraft when the departure will be from the same threshold, a parallel runway separated by less than 2,500 feet with less than 500 feet threshold stagger, or on a crossing runway and projected flight paths will cross:
- Three minutes or the appropriate radar separation when takeoff will be behind a super aircraft;
- Two minutes or the appropriate radar separation when takeoff will be behind a heavy aircraft.
- Two minutes or the appropriate radar separation when a small aircraft will takeoff behind a B757.
- A 3-minute interval will be provided for a small aircraft taking off:
- From an intersection on the same runway (same or opposite direction) behind a departing large aircraft (except B757), or
- In the opposite direction on the same runway behind a large aircraft (except B757) takeoff or low/missed approach.
- A 3-minute interval will be provided when a small aircraft will takeoff:
- From an intersection on the same runway (same or opposite direction) behind a departing B757, or
- In the opposite direction on the same runway behind a B757 takeoff or low/missed approach.
- A 4-minute interval will be provided for all aircraft taking off behind a super aircraft, and a 3-minute interval will be provided for all aircraft taking off behind a heavy aircraft when the operations are as described in subparagraphs 28.9.4.1 and 28.9.4.2 above, and are conducted on either the same runway or parallel runways separated by less than 2,500 feet. Controllers may not reduce or waive this interval.
- Pilots may request additional separation (i.e., 2 minutes instead of 4 or 5 miles) for wake turbulence avoidance. This request should be made as soon as practical on ground control and at least before taxiing onto the runway.
- Controllers may anticipate separation and need not withhold a takeoff clearance for an aircraft departing behind a large, heavy, or super aircraft if there is reasonable assurance the required separation will exist when the departing aircraft starts takeoff roll.
- Because of the possible effects of wake turbulence, controllers are required to apply no less than minimum required separation to all aircraft operating behind a Super or Heavy, and to Small aircraft operating behind a B757, when aircraft are IFR; VFR and receiving Class B, Class C, or TRSA airspace services; or VFR and being radar sequenced.
29. . International Civil Aviation Organization (ICAO) Weather Formats
- The U.S. uses the ICAO world standard for aviation weather reporting and forecasting. The World Meteorological Organization's (WMO) publication No. 782 “Aerodrome Reports and Forecasts” contains the base METAR and TAF code as adopted by the WMO member countries.
- Although the METAR code is adopted worldwide, each country is allowed to make modifications or exceptions to the code for use in their particular country, e.g., the U.S. will continue to use statute miles for visibility, feet for RVR values, knots for wind speed, and inches of mercury for altimetry. However, temperature and dew point will be reported in degrees Celsius. The U.S reports prevailing visibility rather than lowest sector visibility. The elements in the body of a METAR report are separated with a space. The only exceptions are RVR, temperature, and dew point which are separated with a solidus (/). When an element does not occur, or cannot be observed, the preceding space and that element are omitted from that particular report. A METAR report contains the following sequence of elements in the following order:
- Type of report.
- ICAO station identifier.
- Date and time of report.
- Modifier (as required).
- Wind.
- Visibility.
- Runway Visual Range (RVR).
- Weather phenomena.
- Sky conditions.
- Temperature/Dew point group.
- Altimeter.
- Remarks (RMK).
- The following paragraphs describe the elements in a METAR report.
- Type of Report. There are two types of reports:
- The METAR, an aviation routine weather report.
- The SPECI, a nonroutine (special) aviation weather report.
The type of report (METAR or SPECI) will always appear as the lead element of the report.
- ICAO Station Identifier. The METAR code uses ICAO 4-letter station identifiers. In the contiguous 48 states, the 3-letter domestic station identifier is prefixed with a “K”; i.e., the domestic identifier for Seattle is SEA while the ICAO identifier is KSEA. For Alaska, all station identifiers start with “PA”; for Hawaii, all station identifiers start with “PH.” The identifier for the eastern Caribbean is “T” followed by the individual country's letter; i.e., Puerto Rico is “TJ.” For a complete worldwide listing see ICAO Document 7910, “Location Indicators.”
- Date and Time of Report. The date and time the observation is taken are transmitted as a six-digit date/time group appended with Z to denote Coordinated Universal Time (UTC). The first two digits are the date followed with two digits for hour and two digits for minutes.
- Modifier (As Required). “AUTO” identifies a METAR/SPECI report as an automated weather report with no human intervention. If “AUTO” is shown in the body of the report, the type of sensor equipment used at the station will be encoded in the remarks section of the report. The absence of “AUTO” indicates that a report was made manually by an observer or that an automated report had human augmentation/backup. The modifier “COR” indicates a corrected report that is sent out to replace an earlier report with an error.
- Wind. The wind is reported as a five digit group (six digits if speed is over 99 knots). The first three digits are the direction from which the wind is blowing, in tens of degrees referenced to true north, or “VRB” if the direction is variable. The next two digits is the wind speed in knots, or if over 99 knots, the next three digits. If the wind is gusty, it is reported as a “G” after the speed followed by the highest gust reported. The abbreviation “KT” is appended to denote the use of knots for wind speed.
- Peak Wind. Whenever the peak wind exceeds 25 knots, “PK WND” will be included in Remarks; e.g., PK WND 280045/1955 “Peak wind two eight zero at four five occurred at one niner five five.” If the hour can be inferred from the report time, only the minutes will be appended; e.g., PK WND 34050/38 “Peak wind three four zero at five zero occurred at three eight past the hour.”
- Wind Shift. Whenever a wind shift occurs, “WSHFT” will be included in remarks followed by the time the wind shift began; e.g., WSHFT 30 FROPA “Wind shift at three zero due to frontal passage.”
- Visibility. Prevailing visibility is reported in statute miles with “SM” appended to it.
- Tower/Surface Visibility. If either tower or surface visibility is below 4 statute miles, the lesser of the 2 will be reported in the body of the report; the greater will be reported in remarks.
- Automated Visibility. ASOS/AWOS visibility stations will show visibility 10 or greater than 10 miles as “10SM.” AWOS visibility stations will show visibility less than 1/4 statute mile as “M1/4SM” and visibility 10 or greater than 10 miles as “10SM.”
- Variable Visibility. Variable visibility is shown in remarks when rapid increase or decrease by 1/2 statute mile or more and the average prevailing visibility is less than 3 statute miles; e.g., VIS 1V2 means “visibility variable between 1 and 2 statute miles.”
- Sector Visibility. Sector visibility is shown in remarks when it differs from the prevailing visibility, and either the prevailing or sector visibility is less than 3 statute miles.
- Runway Visual Range (when reported). “R” identifies the group followed by the runway heading (and parallel runway designator, if needed) “/” and the visual range in feet (meters in other countries) followed with “FT.” (“Feet” is not spoken.)
- Variability Values. When RVR varies by more than on reportable value, the lowest and highest values are shown with “V” between them.
- Maximum/Minimum Range. “P” indicates an observed RVR is above the maximum value for this system (spoken as “more than”). “M” indicates an observed RVR is below the minimum value which can be determined by the system (spoken as “less than”).
- Weather Phenomena. In METAR, weather is reported in the format:
Intensity / Proximity / Descriptor / Precipitation / Obstruction to Visibility / Other
- Intensity applies only to the first type of precipitation reported. A “-” denotes light, no symbol denotes moderate, and a “+” denotes heavy.
- Proximity applies to and is reported only for weather occurring in the vicinity of the airport (between 5 and 10 miles of the point(s) of observation). It is denoted by the letters “VC.” (Intensity and “VC” will not appear together in the weather group.)
- Descriptor. These eight descriptors apply to the precipitation or obstructions to visibility:
TS
thunderstorm
DR
low drifting
SH
showers
MI
shallow
FZ
freezing
BC
patches
BL
blowing
PR
partial
- Precipitation. There are nine types of precipitation in the METAR code:
RA
rain
DZ
drizzle
SN
snow
GR
hail (1/4I or greater)
GS
small hail/snow pellets
PL
ice pellets
SG
snow grains
IC
ice crystals
UP
unknown precipitation (automated stations only)
- Obstructions to Visibility. Obscurations are any phenomena in the atmosphere, other than precipitation, that reduce horizontal visibility. There are eight types of obscuration phenomena in the METAR code:
FG
fog (visibility less than 5/8 mile)
HZ
haze
FU
smoke
PY
spray
BR
mist (visibility 5/8-6 miles)
SA
sand
DU
dust
VA
volcanic ash
- Other. There are five categories of other weather phenomena which are reported when they occur:
SQ
squall
SS
sandstorm
DS
duststorm
PO
dust/sand whirls
FC
+FCfunnel cloud
tornado/waterspoutEXAMPLES-
TSRA
thunderstorm with moderate rain
+SN
heavy snow
-RA FG
light rain and fog
BRHZ
mist and haze (visibility 5/8 mile or greater)
FZDZ
freezing drizzle
VCSH
rain shower in the vicinity
+SHRASNPL
heavy rain showers, snow, ice pellets (Intensity indicator refers to the predominant rain.)
- Sky Condition. In METAR, sky condition is reported in the format:
Amount / Height / (Type) or Indefinite Ceiling / Height
- Amount. The amount of sky cover is reported in eighths of sky cover, using contractions:
SKC
clear (no clouds)
FEW
>0/8 to 2/8 cloud cover
SCT
scattered (3/8 to 4/8 cloud cover)
BKN
broken (5/8 to 7/8 cloud cover)
OVC
overcast (8/8 cloud cover)
CB
cumulonimbus when present
TCU
towering cumulus when present
- Height. Cloud bases are reported with three digits in hundreds of feet above ground level (AGL). (Clouds above 12,000 feet cannot be reported by an automated station).
- Type. If towering cumulus clouds (TCU) or cumulonimbus clouds (CB) are present, they are reported after the height which represents their base.
- Vertical Visibility (indefinite ceiling height). The height into an indefinite ceiling is preceded by “VV” and followed by three digits indicating the vertical visibility in hundreds of feet. This layer indicates total obscuration.
- Obscurations are reported when the sky is partially obscured by a ground-based phenomena by indicating the amount of obscuration as FEW, SCT, BKN followed by three zeros (000). In remarks, the obscuring phenomenon precedes the amount of obscuration and three zeros.
- When sky conditions include a layer aloft other than clouds, such as smoke or haze, the type of phenomena, sky cover, and height are shown in remarks.
- Variable Ceiling. When a ceiling is below three thousand and is variable, the remark “CIG” will be shown followed with the lowest and highest ceiling heights separated by a “V.”
- Second Site Sensor. When an automated station uses meteorological discontinuity sensors, remarks will be shown to identify site specific sky conditions which differ and are lower than conditions reported in the body.
- Variable Cloud Layer. When a layer is varying in sky cover, remarks will show the variability range. If there is more than one cloud layer, the variable layer will be identified by including the layer height.
- Significant Clouds. When significant clouds are observed, they are shown in remarks, along with the specified information as shown below:
- Cumulonimbus (CB), or Cumulonimbus Mammatus (CBMAM), distance (if known), direction from the station, and direction of movement, if known. If the clouds are beyond 10 miles from the airport, DSNT will indicate distance.
- Towering Cumulus (TCU), location, (if known), or direction from the station.
- Altocumulus Castellanus (ACC), Stratocumulus Standing Lenticular (SCSL), Altocumulus Standing Lenticular (ACSL), Cirrocumulus Standing Lenticular (CCSL) or rotor clouds, describing the clouds (if needed), and the direction from the station.
ACC W
“altocumulus castellanus west”
ACSL SW-S
“standing lenticular altocumulus southwest through south”
APRNT ROTOR CLD S
“apparent rotor cloud south”
CCSL OVR MT E
“standing lenticular cirrocumulus over the mountains east”
- Amount. The amount of sky cover is reported in eighths of sky cover, using contractions:
- Temperature/Dew Point. Temperature and dew point are reported in two, two-digit groups in degrees Celsius, separated by a solidus (/). Temperatures below zero are prefixed with an “M.” If the temperature is available but the dew point is missing, the temperature is shown followed by a solidus. If the temperature is missing, the group is omitted from the report.
- Altimeter. Altimeter settings are reported in a four-digit format in inches of mercury prefixed with an “A” to denote the units of pressure.
- Remarks. Remarks will be included in all observations, when appropriate. The contraction “RMK” denotes the start of the remarks section of a METAR report.
Except for precipitation, phenomena located within 5 statute miles of the point of observation will be reported as at the station. Phenomena between 5 and 10 statute miles will be reported in the vicinity, “VC.” Precipitation not occurring at the point of observation but within 10 statute miles is also reported as in the vicinity, “VC.” Phenomena beyond 10 statute miles will be shown as distant, “DSNT.” Distances are in statute miles except for automated lightning remarks which are in nautical miles. Movement of clouds or weather will be indicated by the direction toward which the phenomena is moving.
There are two categories of remarks: Automated, Manual, and Plain Language; and Additive and Automated Maintenance Data.
- Automated, Manual, and Plain Language Remarks. This group of remarks may be generated from either manual or automated weather reporting stations and generally elaborates on parameters reported in the body of the report. Plain language remarks are only provided by manual stations.
1) Volcanic Eruptions
2) Tornado, Funnel Cloud, Waterspout
3) Type of Automated Station (AO1 or AO2)
4) Peak Wind
5) Wind Shift
6) Tower or Surface Visibility
7) Variable Prevailing Visibility
8) Sector Visibility
9) Visibility at Second Location
10) Dispatch Visual Range
11) Lightning. When lightning is observed at a manual location, the frequency and location is reported.
When cloud-to-ground lightning is detected by an automated lightning detection system, such as ALDARS:
[a] Within 5 nautical miles (NM) of the Airport Reference Point (ARP), it will be reported as “TS" in the body of the report with no remark;[b] Between 5 and 10 NM of the ARP, it will be reported as “VCTS" in the body of the report with no remark; [c] Beyond 10 but less than 30 NM of the ARP, it will be reported in remarks as “DSNT" followed by the direction from the ARP.LTG DSNT W or LTG DSNT ALQDS
12) Beginning/Ending Time of Precipitation
13) Beginning/Ending Time of Thunderstorms
14) Thunderstorm Location; Movement Direction
15) Hailstone Size
16) Virga
17) Variable Ceiling
18) Obscurations
19) Variable Sky Condition
20) Significant Cloud Types
21) Ceiling Height at Second Location
22) Pressure Rising or Falling Rapidly
23) Sea-Level Pressure
24) Aircraft Mishap (not transmitted)
25) No SPECI Reports Taken
26) Snow Increasing Rapidly
27) Other Significant Information
- Additive and Automated Maintenance Data Remarks.
1) Hourly Precipitation
2) Precipitation Amount
3) 24-Hour Precipitation
4) Snow Depth on Ground
5) Water Equivalent of Snow on Ground
6) Cloud Types
7) Duration of Sunshine
8) Hourly Temperature and Dew Point (Tenths)
9) 6-Hour Maximum Temperature
10) 6-Hour Minimum Temperature
11) 24-Hour Maximum/Minimum Temperatures
12) Pressure Tendency
13) Sensor Status:
WINO
ZRANO
SNO
VRNO
PNO
VISNO
METAR
Type of report (aviation routine weather report)
KSFO
Station identifier (San Francisco, CA)
041453Z
Date/Time (4th day of month; time 1453 UTC)
AUTO
Fully automated; no human intervention
VRB02KT
Wind (wind variable at two)
3SM
Visibility (visibility three statute miles)
BR
Visibility obscured by mist
CLR
No clouds below one two thousand
15/12
Temperature one five; dew point one two
A3012
Altimeter three zero one two
RMK
Remarks
AO2
This automated station has a weather discriminator (for precipitation).
METAR
Aviation routine weather report
KBNA
Nashville, TN
281250Z
28th day of month; time 1250 UTC
(no modifier)
This is a manually generated report, due to the absence of “AUTO” and “AO1 or AO2” in remarks.
33018KT
Wind three three zero at one eight
290V360
Wind variable between two nine zero and three six zero
1/2SM
Visibility one half statute mile
R31/2700FT
Runway three one RVR two thousand seven hundred feet
SN
Moderate snow
BLSN FG
Visibility obscured by blowing snow and fog
VV008
Indefinite ceiling eight hundred
00/M03
Temperature zero; dew point minus three
A2991
Altimeter two niner niner one
RMK
Remarks
RAE36
Rain ended at three six
SNB42
Snow began at four two
SPECI
Nonroutine aviation special weather report
KCVG
Cincinnati, OH
152224Z
15th day of month; time 2224 UTC
(no modifier)
This is a manually generated report due to the absence of “AUTO” and “AO1 or AO2” in remarks.
28024G36KT
Wind two eight zero at two four gusts three six
3/4SM
Visibility three fourths statute mile
+TSRA
Thunderstorms, heavy rain
BKN008
Ceiling eight hundred broken
OVC020CB
Two thousand overcast cumulonimbus clouds
28/23
Temperature two eight; dew point two three
A3000
Altimeter three zero zero zero
RMK
Remarks
TSRAB24
Thunderstorm and rain began at two four
TS W MOV E
Thunderstorm west moving east
- Automated, Manual, and Plain Language Remarks. This group of remarks may be generated from either manual or automated weather reporting stations and generally elaborates on parameters reported in the body of the report. Plain language remarks are only provided by manual stations.
- Type of Report. There are two types of reports:
- Aerodrome Forecast (TAF). A concise statement of the expected meteorological conditions at an airport during a specified period. At most locations, TAFs have a 24 hour forecast period. However, TAFs for some locations have a 30 hour forecast period. These forecast periods may be shorter in the case of an amended TAF. TAFs use the same codes as METAR weather reports. They are scheduled four times daily for 24-hour periods beginning at 0000Z, 0600Z, 1200Z, and 1800Z.
Forecast times in the TAF are depicted in two ways. The first is a 6-digit number to indicate a specific point in time, consisting of a two-digit date, two-digit hour, and two-digit minute (such as issuance time or FM). The second is a pair of four-digit numbers separated by a “/” to indicatea beginning and end for a period of time. In thiscase,each four-digit pair consists of a two-digit date and a two-digit hour.
TAFs are issued in the following format:
TYPE OF REPORT/ICAO STATION IDENTIFIER/DATE AND TIME OF ORIGIN/VALID PERIOD DATE AND TIME/FORECAST METEOROLOGICAL CONDITIONS
TAF KORD 051130Z 0512/0618 14008KT 5SM BR BKN030
TEMPO 0513/0516 1 1/2SM BR
FM051600 16010KT P6SM SKC
FM052300 20013G20KT 4SM SHRA OVC020
PROB40 0600/0606 2SM TSRA OVC008CB
BECMG 0606/0608 21015KT P6SM NSW SCT040TAF format observed in the above example:
TAF = type of report
KORD = ICAO station identifier
051130Z = date and time of origin (issuance time)
0512/0618 = valid period date and times
14008KT 5SM BR BKN030 = forecast meteorological conditions
- Explanation of TAF elements
- Type of Report. There are two types of TAF issuances, a routine forecast issuance (TAF) and an amended forecast (TAF AMD). An amended TAF is issued when the current TAF no longer adequately describes the on-going weather or the forecaster feels the TAF is not representative of the current or expected weather. Corrected (COR) or delayed (RTD) TAFs are identified only in the communications header which precedes the actual forecasts.
- ICAO Station Identifier. The TAF code uses ICAO 4-letter location identifiers as described in the METAR section.
- Date and Time of Origin. This element is the date and time the forecast is actually prepared. The format is a two-digit date and four-digit time followed, without a space, by the letter “Z.”
- Valid Period Date and Time. he UTC valid period of the forecast consists of two four-digit sets, separated by a “/”. The first four-digit set is a two-digit date followed by the two-digit beginning hour, and the second four-digit set is a two-digit date followed by the two-digit ending hour. Although most airports have a 24-hour TAF, a select number of airports have a 30-hour TAF. In the case of an amended forecast, or a forecast which is corrected or delayed, the valid period may be for less than 24 hours. Where an airport or terminal operates on a part-time basis (less than 24 hours/day), the TAFs issued for those locations will have the abbreviated statement “AMD NOT SKED” added to the end of the forecasts. The time observations are scheduled to end and/or resume will be indicated by expanding the AMD NOT SKED statement. Expanded statements will include:
- Observation ending time (AFT DDHHmm; for example, AFT 120200)
- Scheduled observations resumption time (TIL DDHHmm; for example, TIL 171200Z) or
- Period of observation unavailability (DDHH/DDHH); for example, 2502/2512).
- Forecast Meteorological Conditions. This is the body of the TAF. The basic format is:
Wind / Visibility / Weather / Sky Condition / Optional Data (Wind Shear)
The wind, visibility, and sky condition elements are always included in the initial time group of the forecast. Weather is included only if significant to aviation. If a significant, lasting change in any of the elements is expected during the valid period, a new time period with the changes is included. It should be noted that with the exception of an “FM” group, the new time period will include only those elements which are expected to change; i.e., if a lowering of the visibility is expected but the wind is expected to remain the same, the new time period reflecting the lower visibility would not include a forecast wind. The forecast wind would remain the same as in the previous time period.
Any temporary conditions expected during a specific time period are included with that time period. The following describes the elements in the above format.
- Wind. This five (or six) digit group includes the expected wind direction (first 3 digits) and speed (last 2 digits or 3 digits if 100 knots or greater). The contraction “KT” follows to denote the units of wind speed. Wind gusts are noted by the letter “G” appended to the wind speed followed by the highest expected gust.
- Visibility. The expected prevailing visibility up to and including 6 miles is forecast in statute miles, including fractions of miles, followed by “SM” to note the units of measure. Expected visibilities greater than 6 miles are forecast as P6SM (Plus six statute miles).
- Weather Phenomena. The expected weather phenomena is coded in TAF reports using the same format, qualifiers, and phenomena contractions as METAR reports (except UP).
Obscurations to vision will be forecast whenever the prevailing visibility is forecast to be 6 statute miles or less.
If no significant weather is expected to occur during a specific time period in the forecast, the weather group is omitted for that time period. If, after a time period in which significant weather has been forecast, a change to a forecast of no significant weather occurs, the contraction NSW (no significant weather) will appear as the weather group in the new time period. (NSW is included only in temporary (TEMPO) groups.)
- Sky Condition. TAF sky condition forecasts use the METAR format described in the METAR section. Cumulonimbus clouds (CB) are the only cloud type forecast in TAFs. When clear skies are forecast, the contraction “SKC” will always be used. The contraction “CLR” is never used in the aerodrome forecast (TAF). When the sky is obscured due to a surface-based phenomenon, vertical visibility (VV) into the obscuration is forecast. The format for vertical visibility is “VV” followed by a three-digit height in hundreds of feet.
SKC
“sky clear”
SCT005 BKN025CB
“five hundred scattered, ceiling two thousand five hundred broken cumulonimbus clouds”
VV008
“indefinite ceiling eight hundred”
- Optional Data (Wind Shear). Wind Shear is the forecast of non-convective, low-level winds (up to 2,000 feet). The forecast includes the letters “WS” followed by the height of the wind shear, the wind direction and wind speed at the indicated height and the ending letters “KT” (knots). Height is given in hundreds of feet (AGL) up to and including 2,000 feet. Wind shear is encoded with the contraction “WS” followed by a three-digit height, slant character “/” and winds at the height indicated in the same format as surface winds. The wind shear element is omitted if not expected to occur.
WS010/18040KT
“low level wind shear at one thousand, wind one eight zero at four zero”
- Explanation of TAF elements
- Probability Forecast. The probability or chance of thunderstorms or other precipitation events occurring, along with associated weather conditions (wind, visibility, and sky conditions). The PROB30 group is used when the occurrence of thunderstorms or precipitation is 30-39% and the PROB40 group is used when the occurrence of thunderstorms or precipitation is 40-49%. This is followed by two four-digit groups separated by a “/”, giving the beginning date and hour, and the ending date and hour of the time period during which the thunderstorms or precipitation are expected.
- Forecast Change Indicators. The following change indicators are used when either a rapid, gradual, or temporary change is expected in some or all of the forecast meteorological conditions. Each change indicator marks a time group within the TAF report.
- From (FM) Group. The FM group is used when a rapid change, usually occurring in less than one hour, in prevailing conditions is expected. Typically, a rapid change of prevailing conditions to more or less a completely new set of prevailing conditions is associated with a synoptic feature passing through the terminal area (cold or warm frontal passage). Appended to the “FM” indicator is the six-digit date, hour, and minute the change is expected to begin and continues until the next change group or until the end of the current forecast. A “FM” group will mark the beginning of a new line in a TAF report (indented 5 spaces). Each “FM” group contains all the required elements-wind, visibility, weather, and sky condition. Weather will be omitted in “FM” groups when it is not significant to aviation. FM groups will not include the contraction NSW.
- Becoming (BECMG) Group. The BECMG group is used when a gradual change in conditions is expected over a longer time period, usually two hours. The time period when the change is expected is two four-digit groups separated by a “/”, with the beginning date and hour, and ending date and hour of the change period which follows the BECMG indicator. The gradual change will occur at an unspecified time within this time period. Only the changing forecast meteorological conditions are included in BECMG groups. The omitted conditions are carried over from the previous time group.
- Temporary (TEMPO) Group. The TEMPO group is used for any conditions in wind, visibility, weather, or sky condition which are expected to last for generally less than an hour at a time (occasional), and are expected to occur during less than half the time period. The TEMPO indicator is followed by two four-digit groups separated by a “/”. The first four digit group gives the beginning date and hour, and the second four digit group gives the ending date and hour of the time period during which the temporary conditions are expected. Only the changing forecast meteorological conditions are included in TEMPO groups. The omitted conditions are carried over from the previous time group.
Key to Aerodrome Forecast (TAF) and Aviation Routine Weather Report (METAR) (Front)
TAF
KPIT 091730Z 0918/1024 15005KT 5SM HZ FEW020 WS010/31022KTFM091930 30015G25KT 3SM SHRA OVC015 TEMPO 0920/0922 1/2SM +TSRA OVC008CBFM100100 27008KT 5SM SHRA BKN020 OVC040 PROB30 1004/1007 1SM ‐RA BRFM101015 18005KT 6SM ‐SHRA OVC020 BECMG 1013/1015 P6SM NSW SKC
NOTE: Users are cautioned to confirm DATE and TIME of the TAF. For example FM100000 is 0000Z on the 10th. Do not confuse with 1000Z!
METAR KPIT 091955Z COR 22015G25KT 3/4SM R28L/2600FT TSRA OVC010CB 18/16 A2992 RMK SLP045 T01820159
Forecast
Explanation
Report
TAF
Message type: TAF‐routine or TAF AMD‐amended forecast, METAR‐hourly, SPECI‐special or TESTM‐non‐commissioned ASOS report
METAR
KPIT
ICAO location indicator
KPIT
091730Z
Issuance time: ALL times in UTC “Z”, 2‐digit date, 4‐digit time
091955Z
0918/1024
Valid period, either 24 hours or 30 hours. The first two digits of EACH four digit number indicate the date of the valid period, the final two digits indicate the time (valid from 18Z on the 9th to 24Z on the 10th).
In U.S. METAR: CORrected ob; or AUTOmated ob for automated report with no human intervention; omitted when observer logs on.
COR
15005KT
Wind: 3 digit true‐north direction , nearest 10 degrees (or VaRiaBle); next 2‐3 digits for speed and unit, KT (KMH or MPS); as needed, Gust and maximum speed; 00000KT for calm; for METAR, if direction varies 60 degrees or more, Variability appended, e.g., 180V260
22015G25KT
5SM
Prevailing visibility; in U.S., Statute Miles & fractions; above 6 miles in TAF Plus6SM. (Or, 4‐digit minimum visibility in meters and as required, lowest value with direction)
¾SM
Runway Visual Range: R; 2‐digit runway designator Left, Center, or Right as needed; “/”, Minus or Plus in U.S., 4‐digit value, FeeT in U.S., (usually meters elsewhere); 4‐digit value Variability 4‐digit value (and tendency Down, Up or No change)
R28L/2600FT
HZ
Significant present, forecast and recent weather: see table (on back)
TSRA
FEW020
Cloud amount, height and type: Sky Clear 0/8, FEW >0/8‐2/8, ScaTtered 3/8‐4/8, BroKeN 5/8‐7/8, OverCast 8/8; 3‐digit height in hundreds of ft; Towering Cumulus or CumulonimBus in METAR; in TAF, only CB. Vertical Visibility for obscured sky and height “VV004”. More than 1 layer may be reported or forecast. In automated METAR reports only, CleaR for “clear below 12,000 feet”
OVC 010CB
Temperature: degrees Celsius; first 2 digits, temperature “/” last 2 digits, dew‐point temperature; Minus for below zero, e.g., M06
18/16
Altimeter setting: indicator and 4 digits; in U.S., A‐inches and hundredths; (Q‐hectoPascals, e.g., Q1013)
A2992
WS010/31022KT
In U.S. TAF, non‐convective low‐level (≤2,000 ft) Wind Shear; 3‐digit height (hundreds of ft); “/”; 3‐digit wind direction and 2‐3 digit wind speed above the indicated height, and unit, KT
Key to Aerodrome Forecast (TAF) and Aviation Routine Weather Report (METAR) (Back)
In METAR, ReMarK indicator & remarks. For example: Sea‐ Level Pressure in hectoPascals & tenths, as shown: 1004.5 hPa; Temp/dew‐point in tenths °C, as shown: temp. 18.2°C, dew‐point 15.9°C
RMK SLP045 T01820159
FM091930
FroM: changes are expected at: 2‐digit date, 2‐digit hour, and 2‐digit minute beginning time: indicates significant change. Each FM starts on a new line, indented 5 spaces
TEMPO 0920/0922
TEMPOrary: changes expected for <1 hour and in total, < half of the period between the 2‐digit date and 2‐digit hour beginning, and 2‐digit date and 2‐digit hour ending time
PROB30 1004/1007
PROBability and 2‐digit percent (30 or 40): probable condition in the period between the 2‐digit date & 2‐digit hour beginning time, and the 2‐digit date and 2‐digit hour ending time
BECMG 1013/1015
BECoMinG: change expected in the period between the 2‐digit date and 2‐digit hour beginning time, and the 2‐digit date and 2‐digit hour ending time
Table of Significant Present, Forecast and Recent Weather ‐ Grouped in categories and used in the order listed below; or as needed in TAF, No Significant Weather.
Qualifiers
Intensity or Proximity
“‐” = Light
No sign = Moderate
“+” = Heavy
“VC” = Vicinity, but not at aerodrome. In the US METAR, 5 to 10 SM from the point of observation. In the US TAF, 5 to 10 SM from the center of the runway complex. Elsewhere, within 8000m.
Descriptor
BC – Patches
BL – Blowing
DR – Drifting
FZ – Freezing
MI – Shallow
PR – Partial
SH – Showers
TS – Thunderstorm
Weather Phenomena
Precipitation
DZ – Drizzle
GR – Hail
GS – Small Hail/Snow Pellets
IC – Ice Crystals
PL – Ice Pellets
RA – Rain
SG – Snow Grains
SN – Snow
UP – Unknown Precipitation in automated observations
Obscuration
BR – Mist (≥5/8SM)
DU – Widespread Dust
FG – Fog (<5/8SM)
FU – Smoke
HZ – Haze
PY – Spray
SA – Sand
VA – Volcanic Ash
Other
DS – Dust Storm
FC – Funnel Cloud
+FC – Tornado or Waterspout
PO – Well developed dust or sand whirls
SQ – Squall
SS – Sandstorm
‐ Explanations in parentheses “()” indicate different worldwide practices.
‐ Ceiling is not specified; defined as the lowest broken or overcast layer, or the vertical visibility.
‐ NWS TAFs exclude BECMG groups and temperature forecasts, NWS TAFS do not use PROB in the first 9 hours of a TAF; NWS METARs exclude trend forecasts. US Military TAFs include Turbulence and Icing groups.
30. . Meteorological Broadcasts (ATIS, VHF and LF)
- Automatic Terminal Information Service (ATIS) Broadcasts
- These broadcasts are made continuously and include as weather information only the ceiling, visibility, wind, and altimeter setting of the aerodrome at which they are located.
- Navigational Aids Providing Broadcast Services
- A compilation of navigational aids over which weather broadcasts are transmitted is not available for this publication. Complete information concerning all navigational aids providing this service is contained in the Chart Supplement U.S. Similar information for the Pacific and Alaskan areas is contained in the Chart Supplements Pacific and Alaska.
TBL GEN 3.5-15Meteorological Broadcasts (VOLMET) Name
Call Sign
Frequency
Broadcast
Form
Contents
Emission
Remarks
New York
New York Radio
3485, 6604, 10051, 13270 kHz
H00-05
Aerodrome Forecasts
KDTW Detroit
KCLE Cleveland KCVG CincinnatiVoice
Plain language English
Hourly Reports
KDTW Detroit
KCLE Cleveland KCVG Cincinnati KIND Indianapolis KPIT PittsburghH05-10
SIGMET
Oceanic - New York FIR
Aerodrome Forecasts
KBGR Bangor
KBDL Windsor Locks KCLT CharlotteHourly Reports
KBGR Bangor KBDL Windsor Locks KORF Norfolk
KCLT CharlotteH10-15
Aerodrome Forecasts
KJFK New York KEWR Newark KBOS Boston
Hourly Reports
KJFK New York KEWR Newark KBOS Boston
KBAL Baltimore KIAD WashingtonH15-20
SIGMET
Oceanic - Miami FIR/San Juan FIR
Aerodrome Forecasts
MXKF Bermuda KMIA Miami
KATL AtlantaHourly Reports
MXKF Bermuda KMIA Miami
MYNN Nassau KMCO Orlando KATL AtlantaH30-35
Aerodrome Forecasts
KORD Chicago KMKE Milwaukee KMSP Minneapolis
Hourly Reports
KORD Chicago KMKE Milwaukee KMSP Minneapolis KDTW Detroit
KBOS BostonE35-40
SIGMET
Oceanic - New York FIR
Aerodrome Forecasts
KIND Indianapolis KSTL St. Louis
KPIT PittsburghHourly Reports
KIND Indianapolis KSTL St. Louis
KPIT Pittsburgh KACY Atlantic CityE40-45
Aerodrome Forecasts
KBAL Baltimore KPHL Philadelphia KIAD Washington
Hourly Reports
KBAL Baltimore KPHL Philadelphia KIAD Washington KJFK New York KEWR Newark
E45-50
SIGMET
Oceanic - Miami FIR/San Juan FIR
Aerodrome Forecasts
MYNN Nassau KMCO Orlando
Hourly Reports
MXKF Bermuda KMIA Miami
MYNN Nassau KMCO Orlando KATL Atlanta
KTPA Tampa
KPBI West Palm BeachAll stations operate on A3 emission H24.
All broadcasts are made 24 hours daily, seven days a week.
FIG GEN 3.5-26Key to Decode an ASOS/AWOS (METAR) Observation (Front) 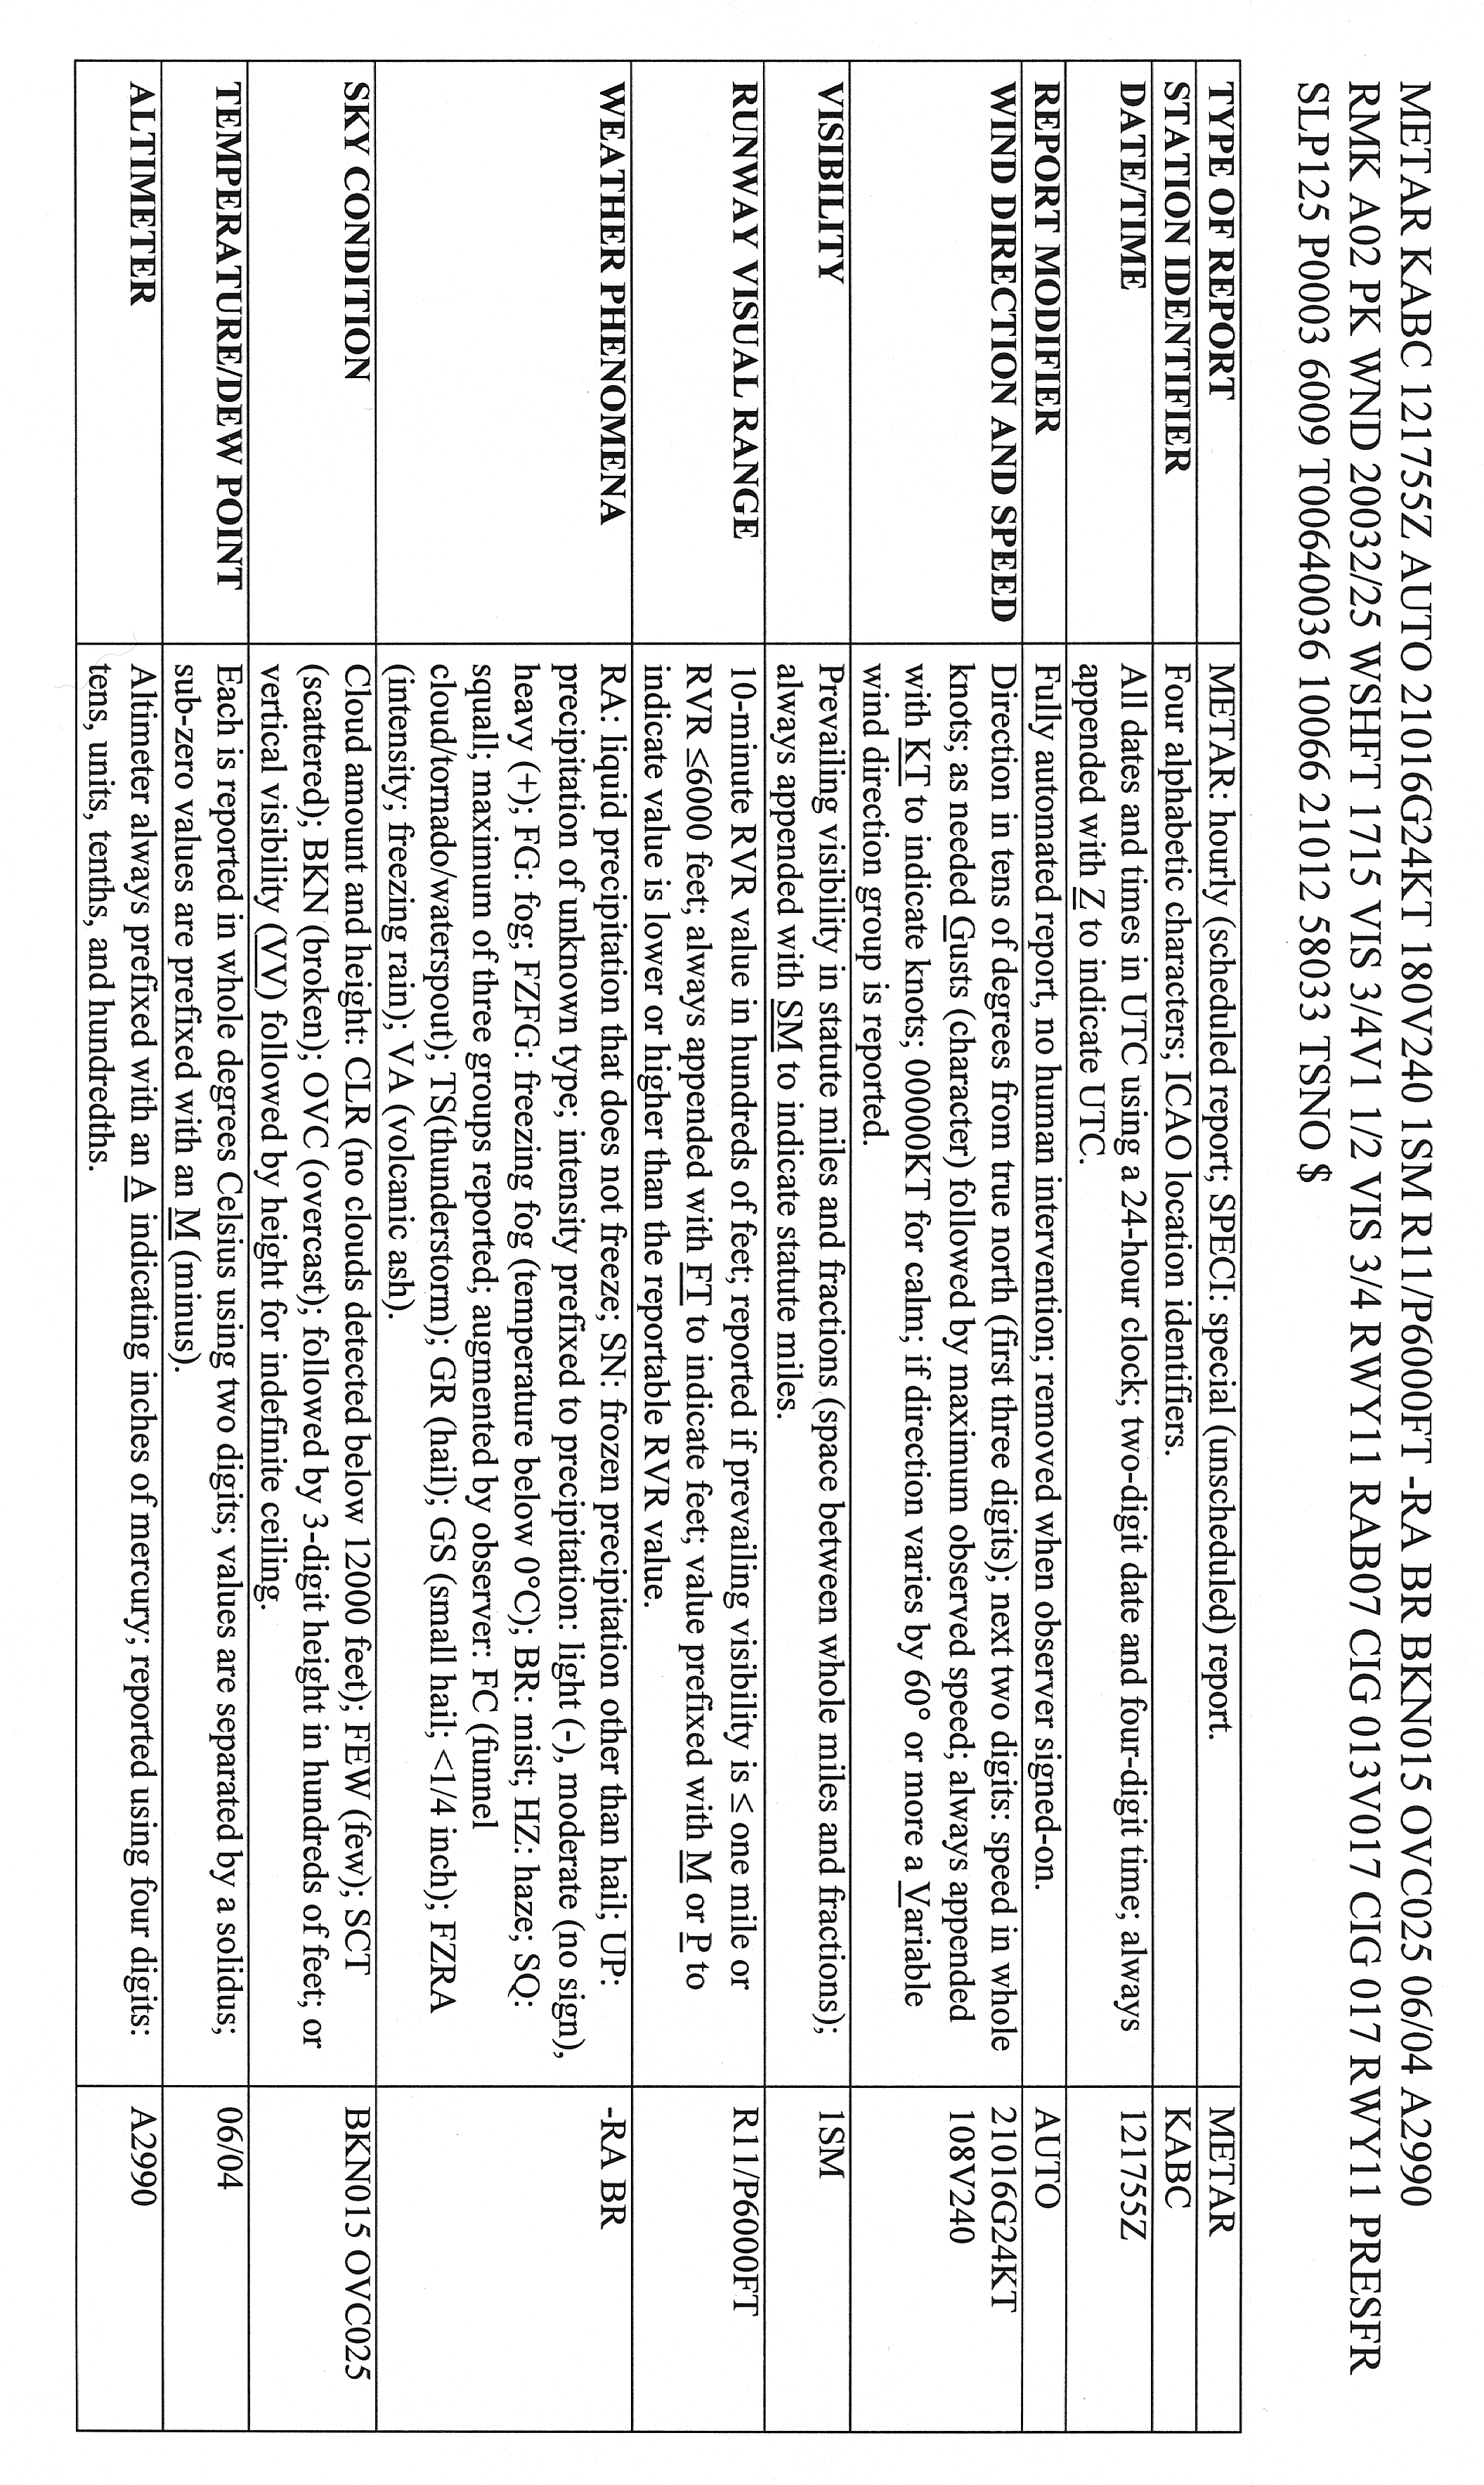
FIG GEN 3.5-27Key to Decode an ASOS/AWOS (METAR) Observation (Back) 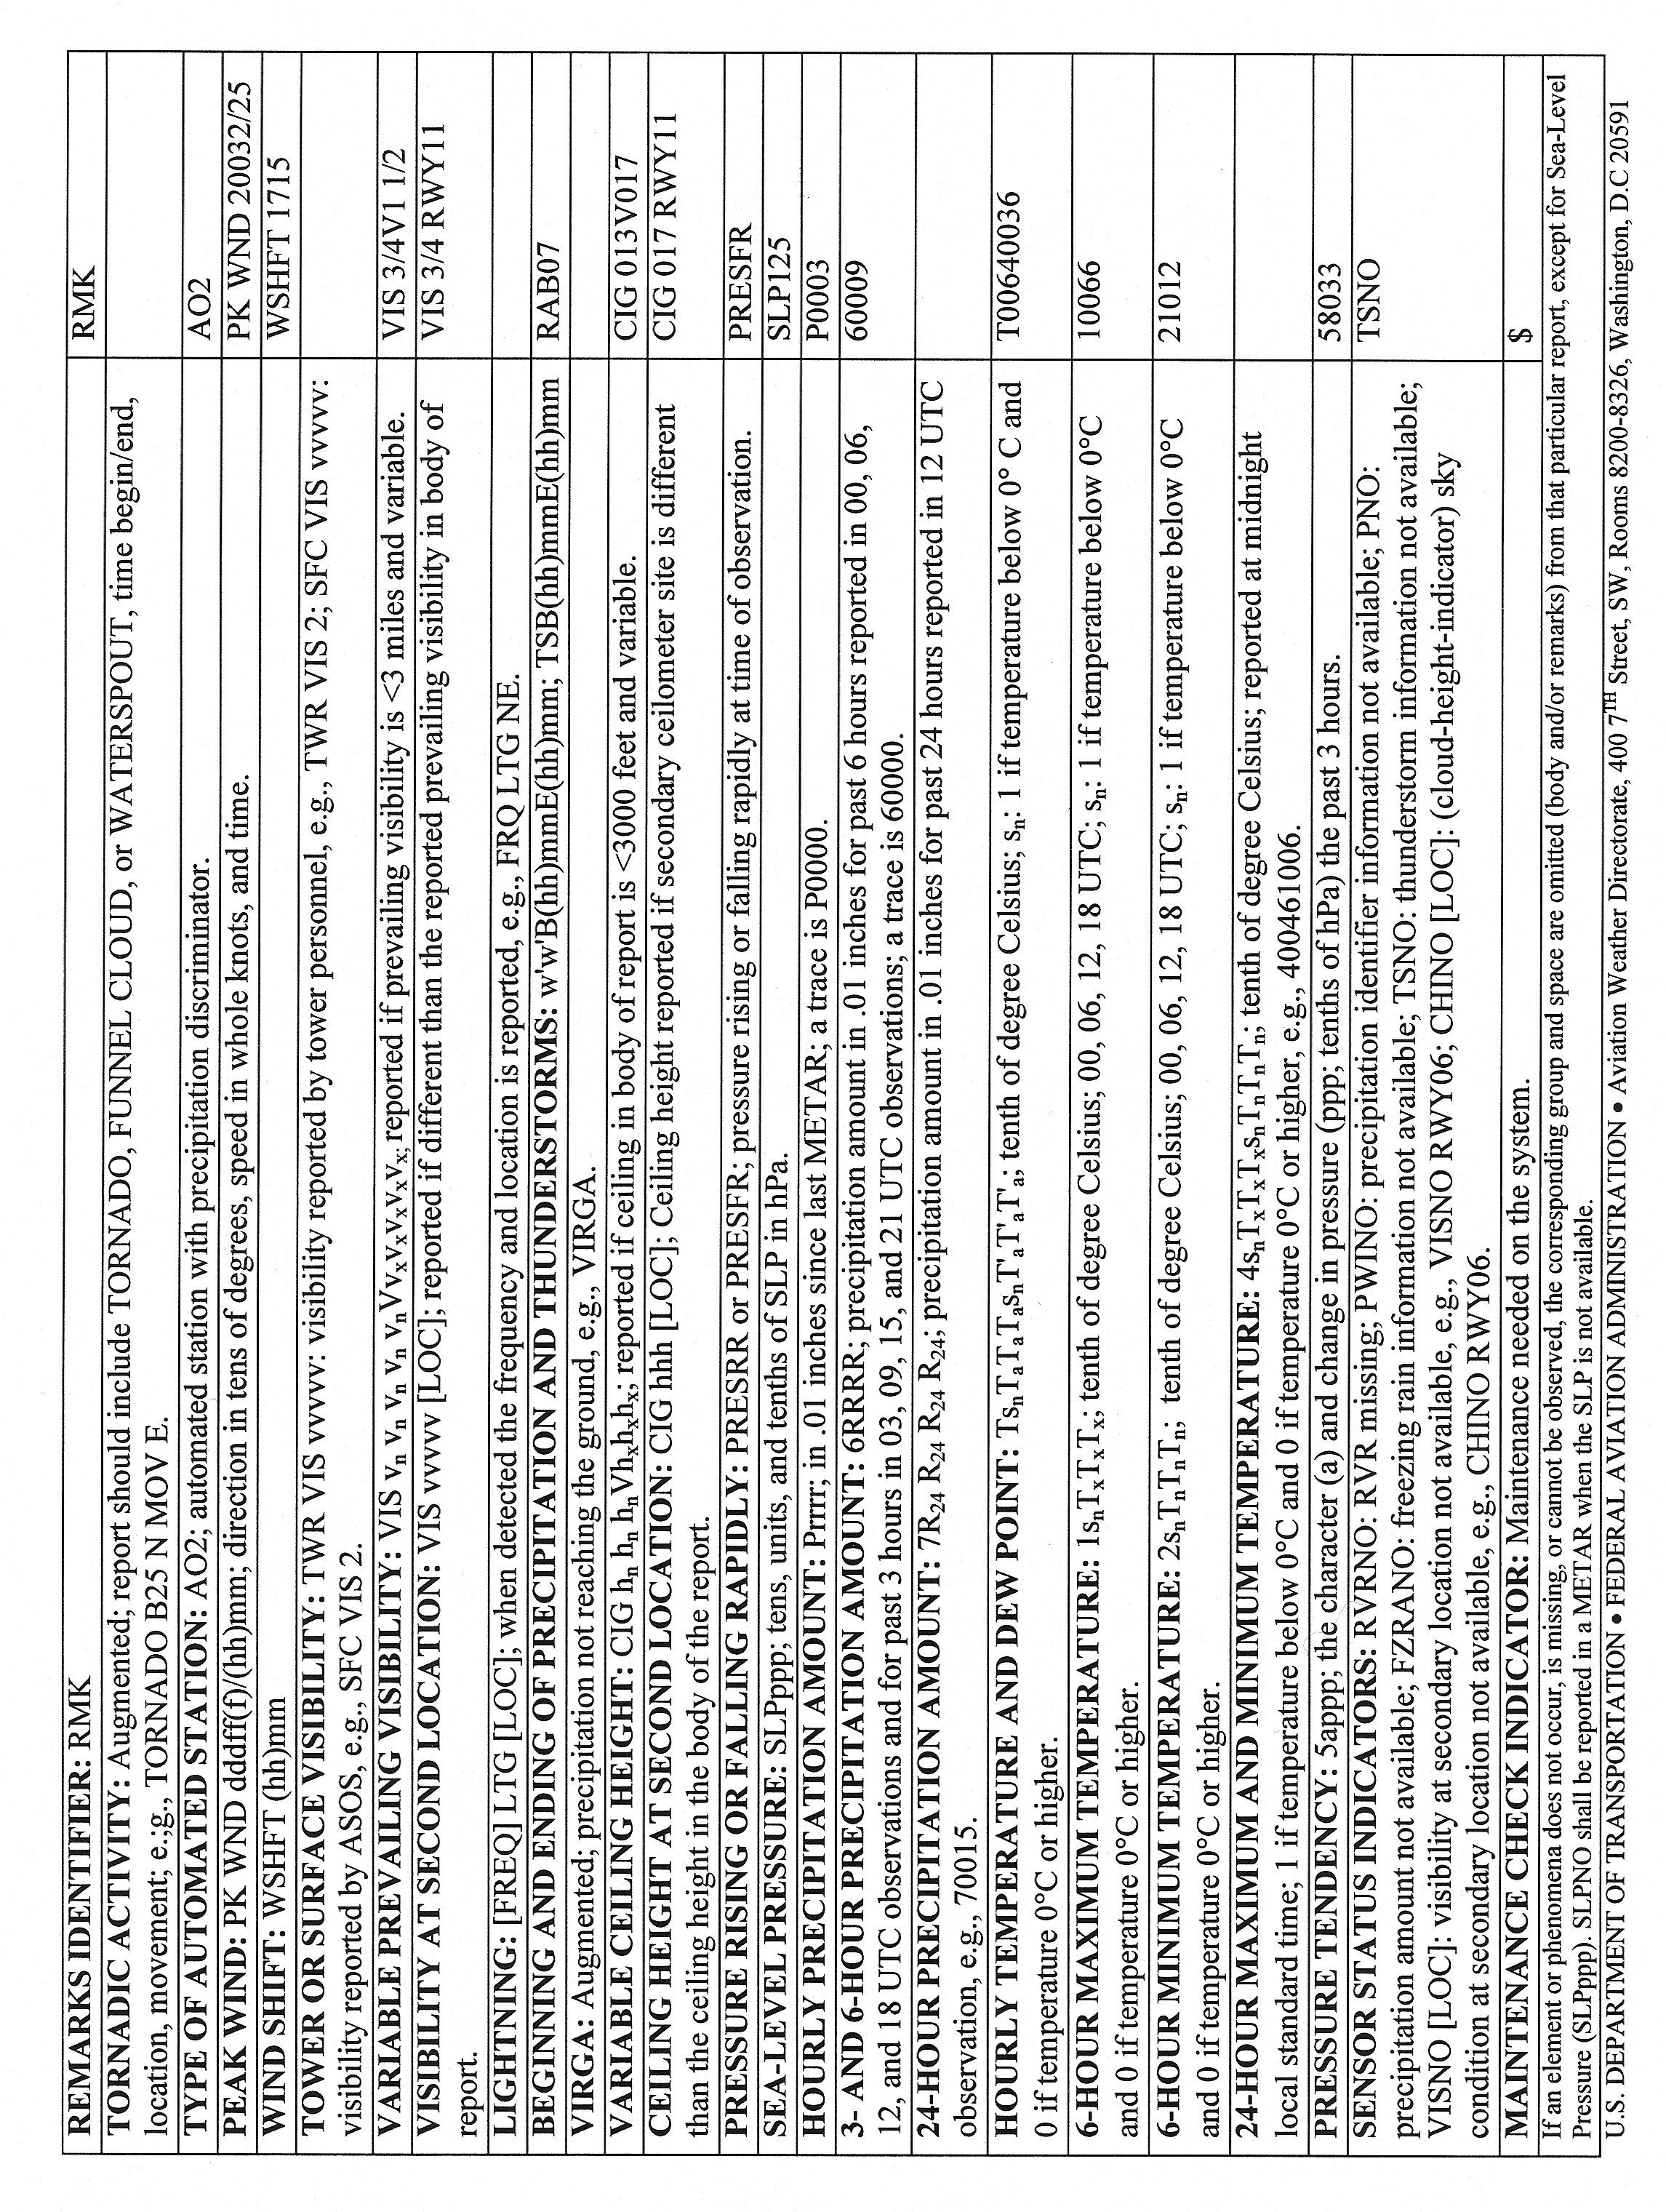
FIG GEN 3.5-28NEXRAD Coverage 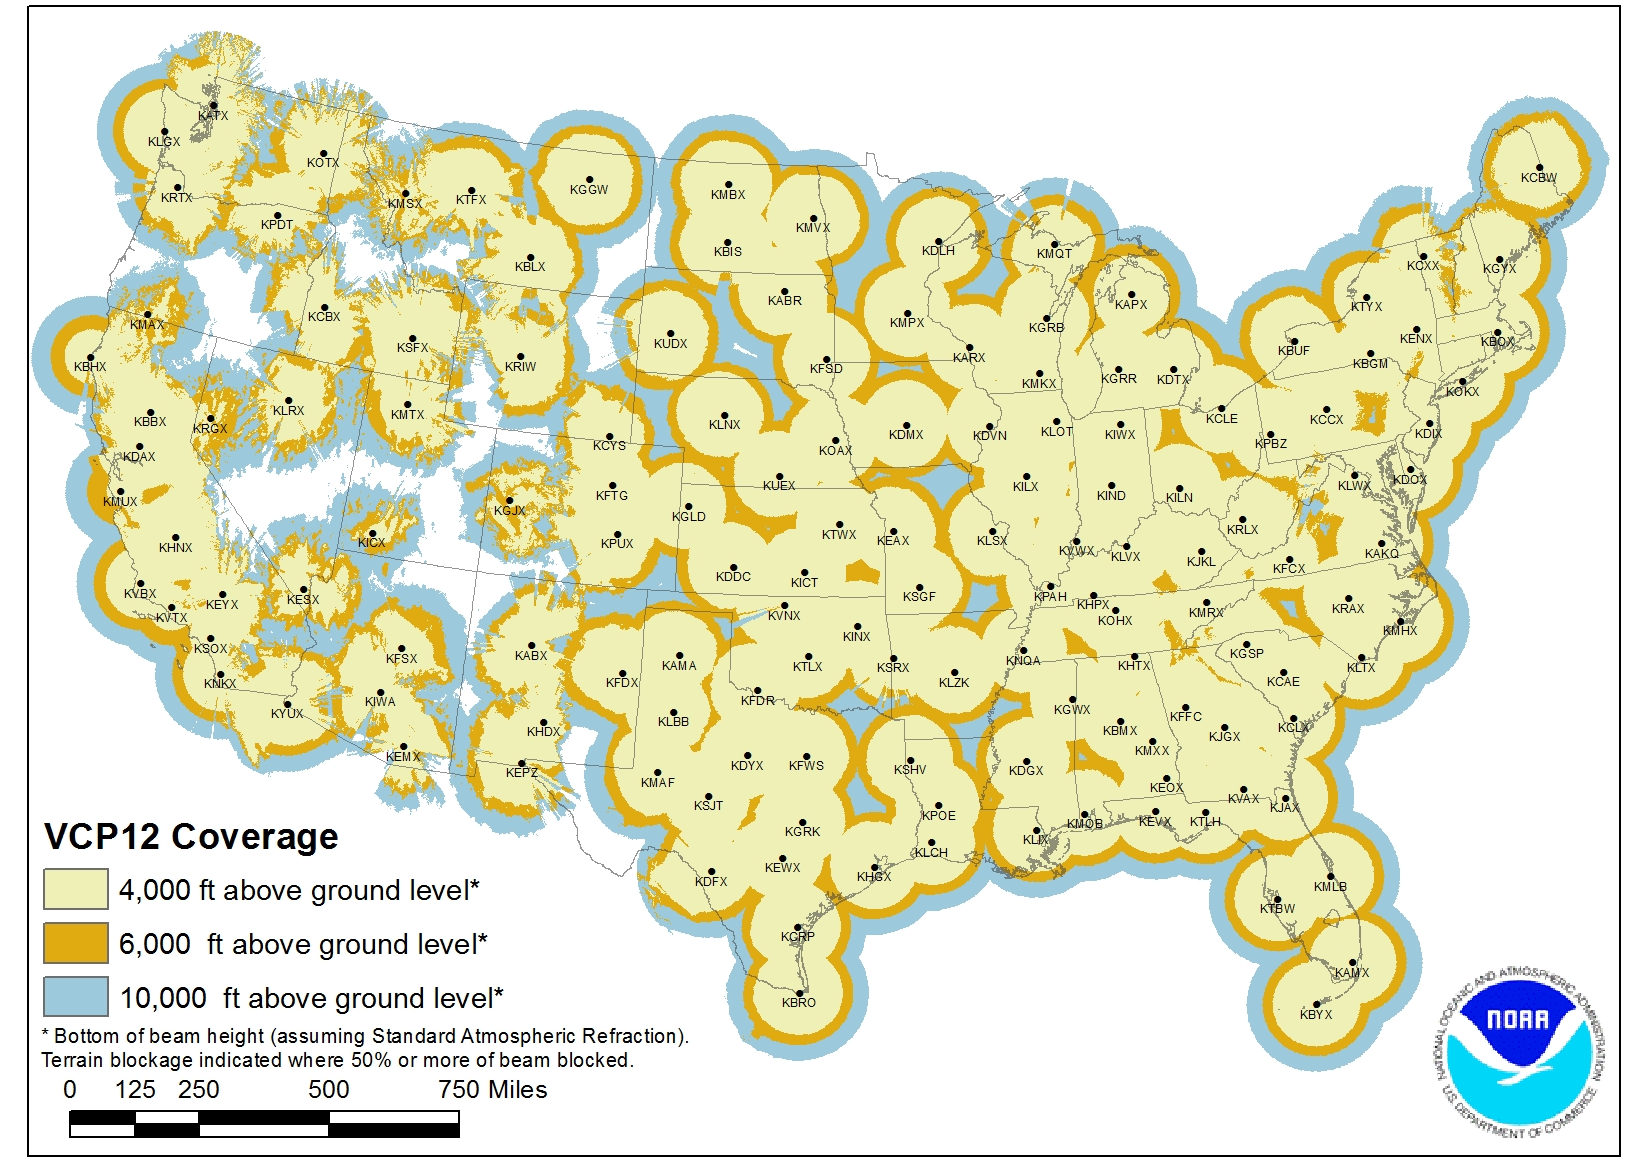
FIG GEN 3.5-29NEXRAD Coverage 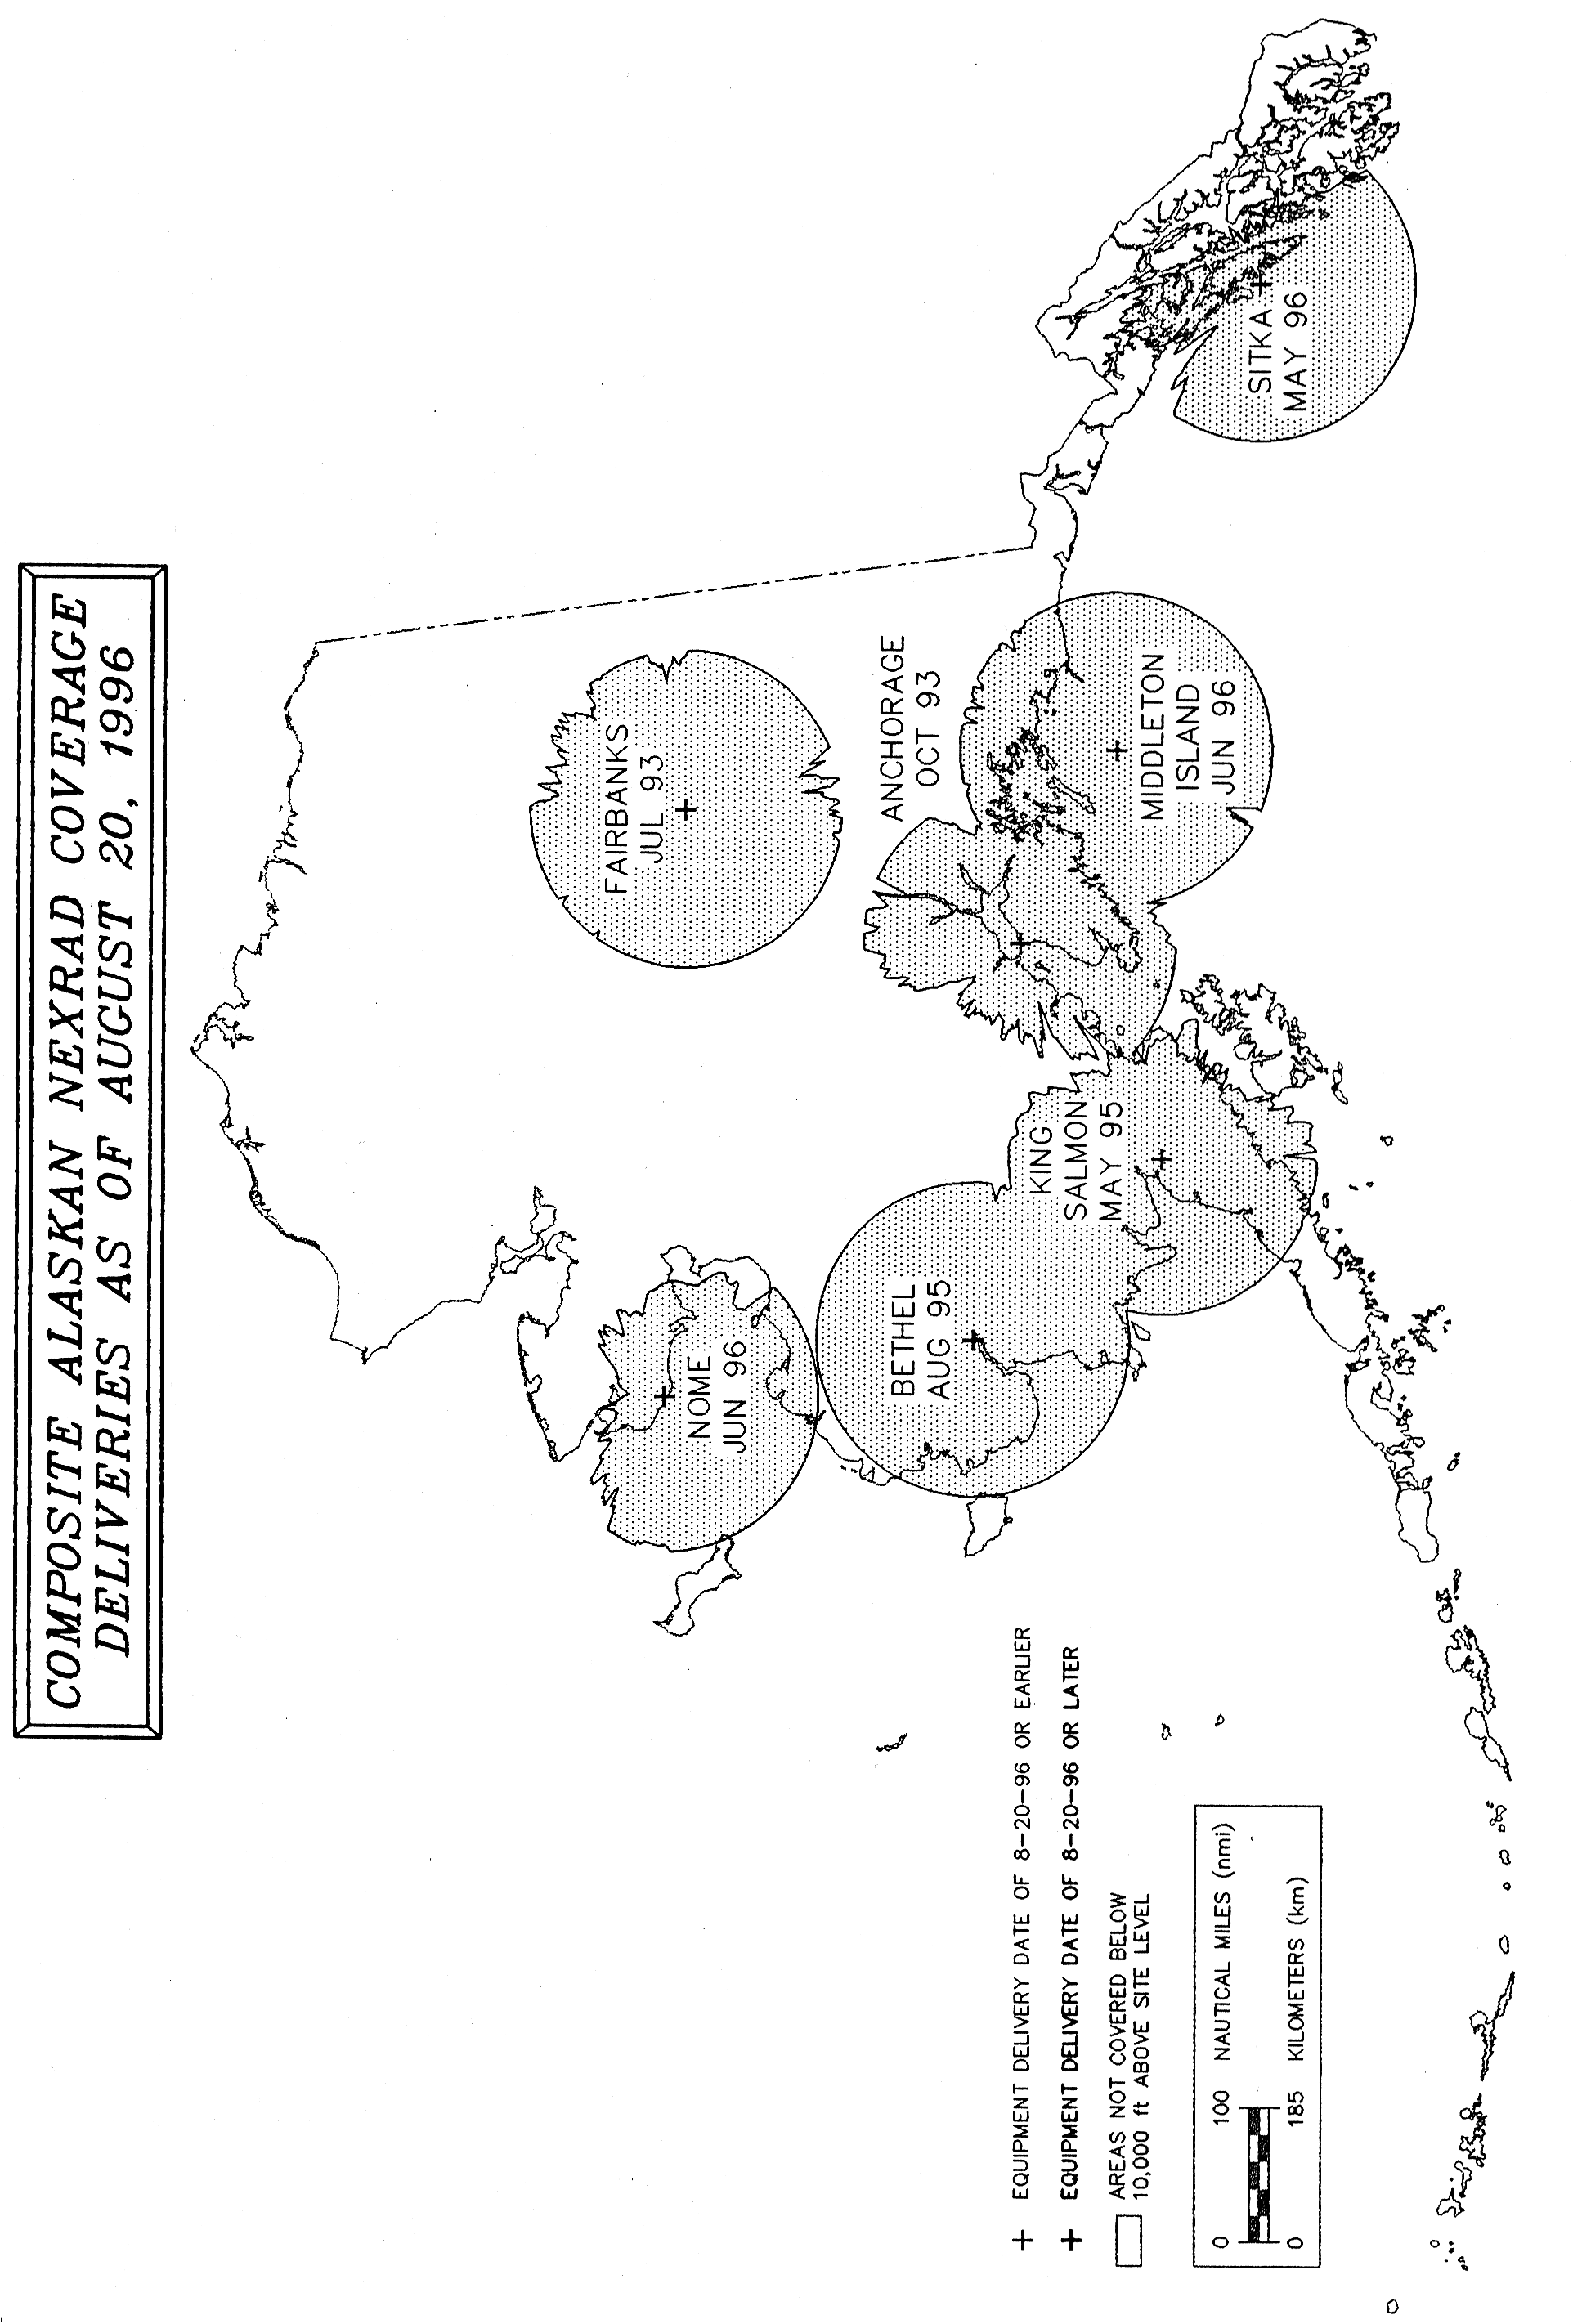
FIG GEN 3.5-30NEXRAD Coverage 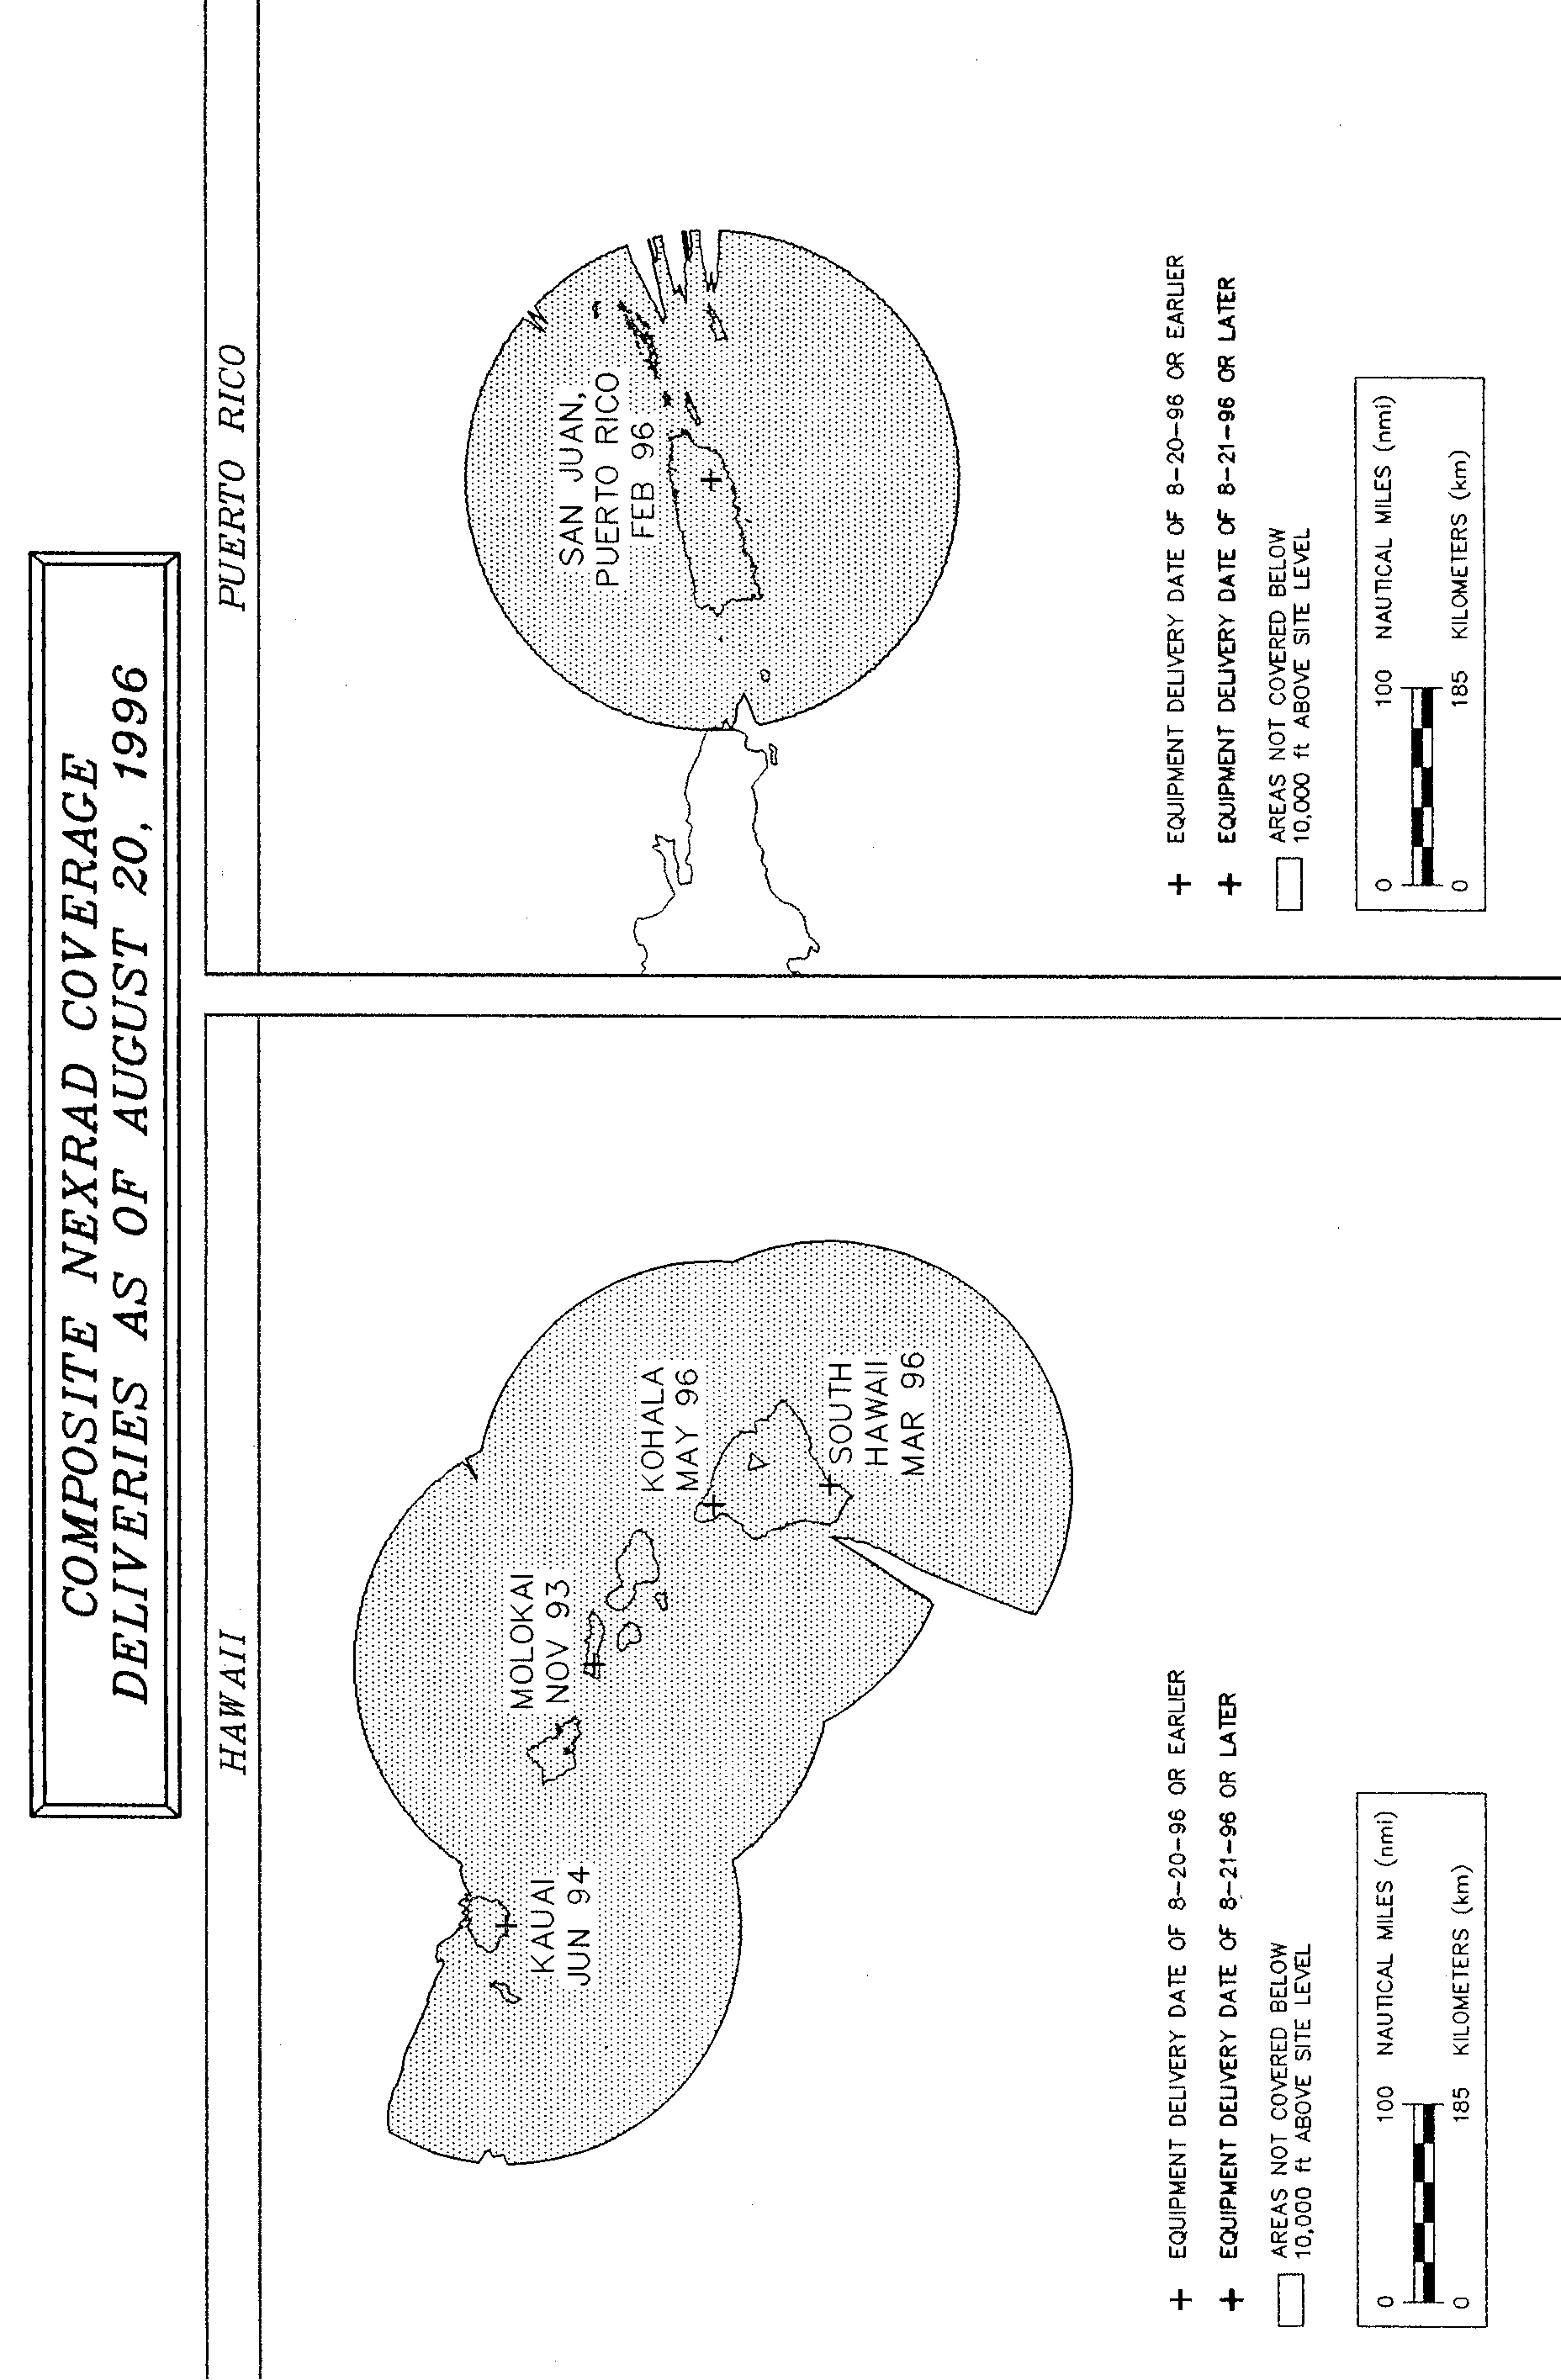
Air-reports are critically important in assessing the hazards which volcanic ash cloud presents to aircraft operations.
OPERATOR:
A/C IDENTIFICATION: (as indicated on flight plan)
PILOT-IN-COMMAND:
DEP FROM:
DATE:
TIME; UTC:
ARR AT:
DATE:
TIME; UTC:
ADDRESSEE
AIREP SPECIAL
Items 1–8 are to be reported immediately to the ATS unit that you are in contact with.
1) AIRCRAFT IDENTIFICATION
2) POSITION
3) TIME
4) FLIGHT LEVEL OR ALTITUDE
5) VOLCANIC ACTIVITY OBSERVED AT(position or bearing, estimated level of ash cloud and distance from aircraft)
6) AIR TEMPERATURE
7) SPOT WIND
8) SUPPLEMENTARY INFORMATION SO2 detected Yes ☐Ash encountered Yes ☐
No ☐ No ☐
Other ______(Brief description of activity especially vertical and lateral extent of ash cloud and, where possible, horizontal movement, rate of growth, etc.)
After landing complete items 9–16 then fax form to: (Fax number to be provided by the meteorological authority based on local arrangements between the meteorological authority and the operator concerned.)
9) DENSITY OF ASH CLOUD
☐
(a) Wispy
☐
(b) Moderate dense
☐
(c) Very dense
10) COLOUR OF ASH CLOUD
☐ (a) White ☐ (d) Black
☐☐
(b) Light grey(e) Other ______
☐
(c) Dark grey
11) ERUPTION
☐
(a) Continuous
☐
(b) Intermittent
☐
(c) Not visible
12) POSITION OF ACTIVITY
☐☐
(a) Summit(d) Multiple
☐☐
(b) Side(e) Not observed
☐
(c) Single
13) OTHER OBSERVED
FEATURES OF ERUPTION☐☐
(a) Lightning(d) Ash fallout
☐☐
(b) Glow(e) Mushroom cloud
☐☐
(c) Large rocks(f) All
14) EFFECT ON AIRCRAFT
☐☐
(a) Communication(d) Pitot static
☐☐
(b) Navigation systems(e) Windscreen
☐☐
(c) Engines(f) Windows
15) OTHER EFFECTS
☐
(a) Turbulence
☐
(b) St. Elmo’s Fire
☐
(c) Other fumes
16) OTHER INFORMATION(Any information considered useful.)
Date: 07/19/2010
- A compilation of navigational aids over which weather broadcasts are transmitted is not available for this publication. Complete information concerning all navigational aids providing this service is contained in the Chart Supplement U.S. Similar information for the Pacific and Alaskan areas is contained in the Chart Supplements Pacific and Alaska.