Section 5. Aviation Surface Forecast/Aviation Cloud Forecast/Area Forecast (FA)
- Area forecasts (FA) are available for the Gulf of Mexico, Caribbean, Hawaii, and Alaska through the WMSCR and provide an overview of weather conditions which could impact aviation operations. FAs are issued by the Aviation Weather Center (AWC) in Kansas City, Missouri, the Alaska Aviation Weather Unit (AAWU) in Anchorage, Alaska, and the Weather Forecast Office (WFO) in Honolulu, Hawaii. The delineation of the areas is specified in the National Weather Service Instruction 10-811. Canadian and Mexican FAs are also available through WMSCR.
- FAs consist of the following elements according to each geographical location in TBL 8-5-1.
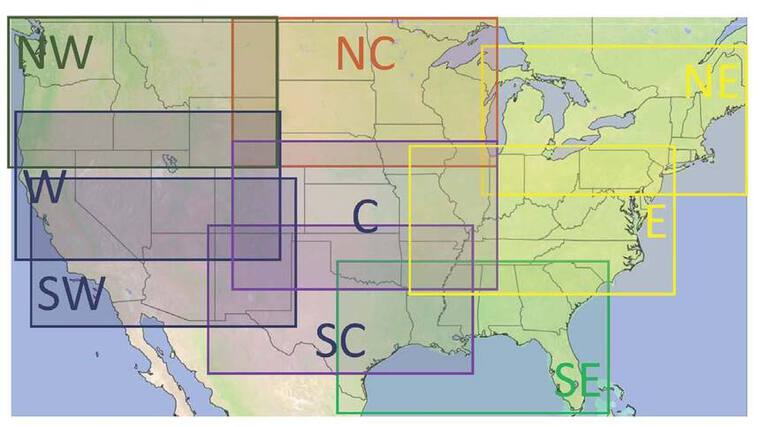
- The Aviation Surface Forecast and Aviation Cloud Forecast are displayed as nine regional views and a CONUS view. These images are produced by the Aviation Weather Center and distributed by NOAAPORT and static URLs. See FIG 8-5-1, Graphical Forecast Images, for regional views.
|
|
Gulf of Mexico |
Caribbean |
Hawaii |
Alaska |
|---|---|---|---|---|
|
Synopsis |
X |
X |
X |
|
|
Clouds and Weather |
X |
X |
X |
X (Includes AIRMETs) |
|
Icing and Freezing Level |
X |
X |
X |
|
|
Turbulence |
X |
X |
X |
FAs are issued three times a day in Alaska and the Gulf of Mexico; and four times a day in Hawaii and the Caribbean. The issuance times are in TBL 8-5-2.
|
|
Gulf of Mexico (UTC) |
Caribbean (UTC) |
Hawaii (UTC) |
Alaska |
|---|---|---|---|---|
|
1st Issuance |
0130 |
0330 |
0340 |
0415 DT |
|
2nd Issuance |
1030 |
0930 |
0940 |
1215 DT |
|
3rd Issuance |
1830 |
1530 |
1540 |
2015 DT |
|
4th Issuance |
2130 |
2140 |
||
|
Note: DT - Daylight Time, ST - Standard Time, UTC - Coordinated Universal Time |
||||
The Aviation Surface Forecast and Aviation Cloud Forecast are issued 8 times a day and are composed of 6 snapshots that are valid for up to 18 hours. The images are based on forecast model run times of 00Z, 03Z, 06Z, 09Z, 12Z, 15Z, 18Z, and 21Z. The actual issuance time will be 1-2 hours after each model run. The delays are due to latency.