


Vertically Speaking: Beware of the Green Dot Syndrome
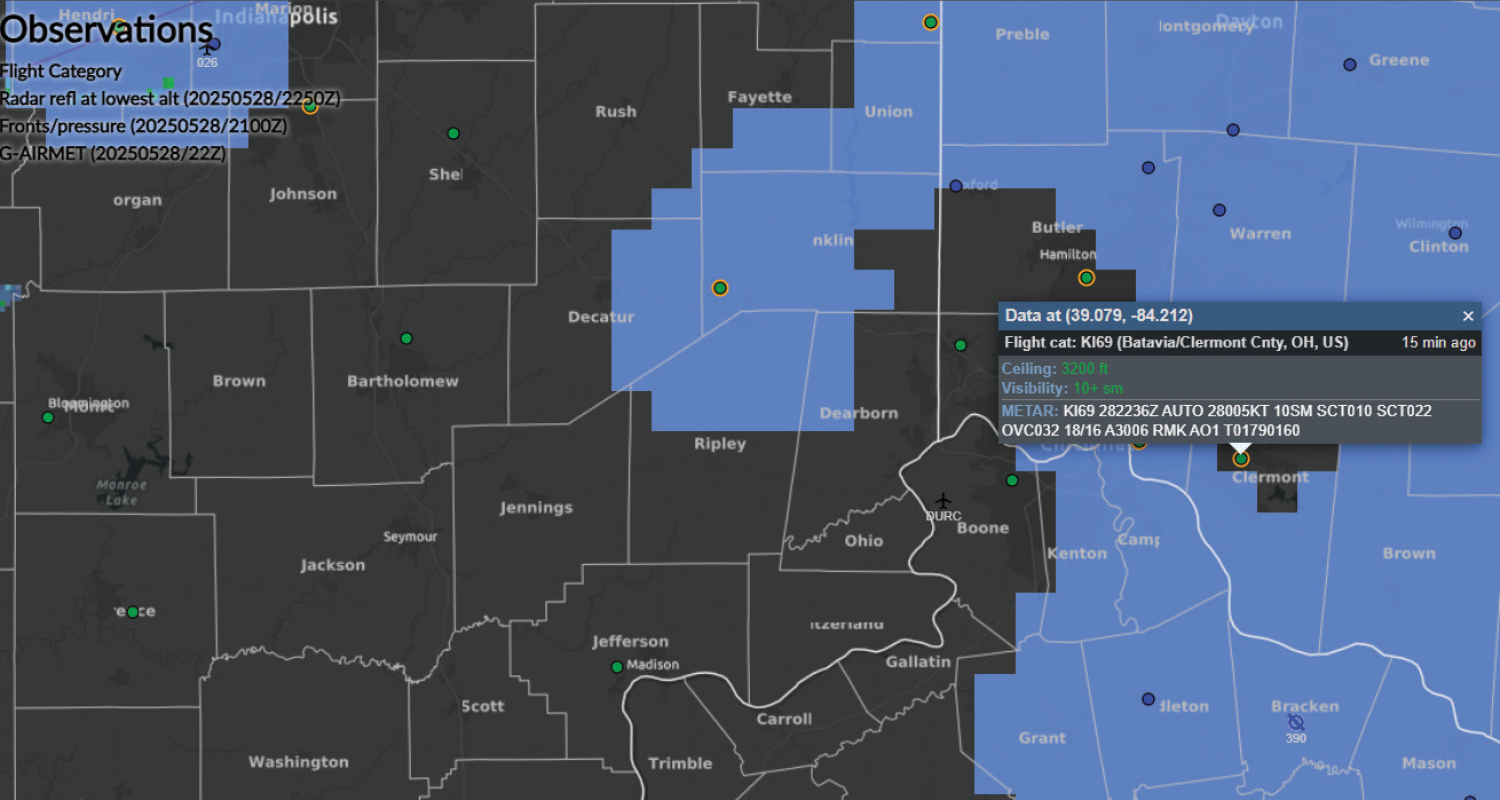
A quick glance at the weather for a short night flight shows green dots at both the departure and destination — good to go right?
The colored dots come straight from the National Weather Service symbology. Green is for visual flight rules (VFR) with ceilings above 3,000 feet and visibilities greater than five statute miles. From there, the conditions get worse. Blue indicates marginal VFR, red is for instrument flight rules (IFR), and magenta is for low IFR, where ceilings are less than 500 feet, or visibility is less than one mile.
The color categories are based on the lowest ceilings, not the lowest overall cloud layer. That means only broken or overcast layers are used to determine the ceiling and corresponding flight category — scattered and few layers do not count. For example, a scattered layer at 400 feet under a broken layer at 3,100 feet would still be categorized as green VFR, despite being just one “sector” away from turning magenta and low IFR.
When the pilot only sees green dots on the weather chart and looks no further, that is what we call the Green Dot Syndrome. Remember, green does not always mean you are good to go.
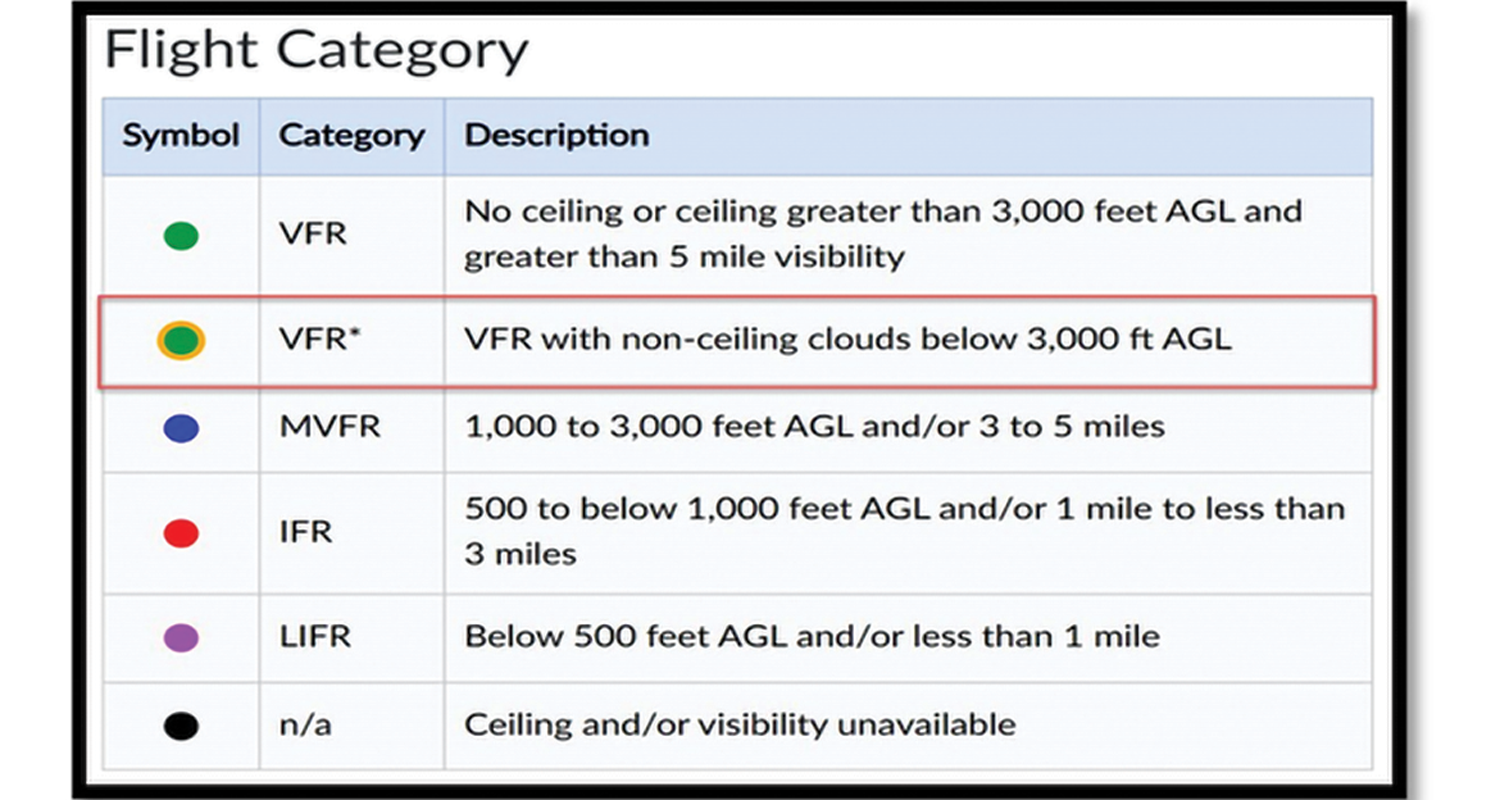
Luckily, the Aviation Weather Center added a new symbol online to help pilots understand the true weather situation — green with a yellow/orange band or ring. This indicates that the ceiling is VFR, but that there are few or scattered cloud layers reported below 3,000 feet above ground level.
Some other things to think about:
- A meteorological aerodrome report (METAR) only samples a small area around the reporting station. Conditions can be very different, even a short distance away.
- Weather can change faster than the METAR update cycle, especially in unstable conditions.
- Watch for small temperature dew point spreads. When the spread narrows, low cloud or fog formation is likely.
- Use all available weather tools, not just the METAR, to build a complete and more accurate picture of current and forecast conditions.
For these very reasons, when making a weather decision, pilots must consider all associated layers of clouds reported, ceiling or not.
Currently, the Aviation Weather Center is the only entity providing pilots with this symbolic information. Incorporate color-coded displays on the observation layer of AviatonWeather.gov in your big-picture weather analysis to see areas with few and scattered layers that could impact you.