Guidelines for Use of FPL Messages for Domestic IFR Flights
Wednesday, November 27, 2024Purpose
These guidelines provide key points to remember when filing a Domestic IFR flight plan using FAA Form 7233-4, International Flight Plan(PDF). A Domestic Flight is defined as one which is conducted wholly within U.S. Domestic airspace (i.e., the conterminous 48 states, Alaska, Hawaii and Puerto Rico), and does not enter international or foreign airspace at any point during the flight. International airspace includes oceanic airspace controlled by FAA ARTCCs at Oakland, New York and Anchorage.
These guidelines supplement, but do not replace, information contained in the FAA ICAO Flight Planning Interface Reference Guide(PDF), and are consistent with detailed specifications for messages contained in ICAO Doc. 4444 (as amended) except as noted herein.
Acronyms
| ACID | Aircraft Identification |
| AIM | Aeronautical Information Manual |
| ARTCC | Air Route Traffic Control Center |
| DP | Departure Procedure |
| ERAS | En Route Automation System |
| FAAO | FAA Order |
| FIR | Flight Information Region |
| FP | NAS Flight Plan Message |
| FPL | ICAO Filed Flight Plan Message |
| FRC | Full Route Clearance |
| FSS | Flight Service Station |
| IAW | In accordance with |
| ICAO | International Civil Aviation Organization |
| LOCID | Location Identifier |
| NADIN | National Aeronautical Data Interchange Network |
| NEW | ICAO message formats defined in ICAO Doc 4444, amendment 1 |
| OTP | VFR on Top |
| PRESENT | ICAO message formats in use prior to ICAO Doc 4444, amendment 1 |
| RNAV | Area Navigation |
| SID | Standard Instrument Departure |
| STAR | Standard Terminal Arrival |
| WTC | ICAO Wake Turbulence Category |
Filing Guidelines for Domestic FPLs
FPL with Minimum Required Information & No Remarks
Domestic FP IAW FAA Form 7233-1:
FF KZJXZQZX
232352 KGAITTTD
TTT2352230 FP TTT001 B722/W 475 TLH P0310 340
TLH..SZW.J41.VUZ.HLI1.MEM/0101
Equivalent FPL IAW FAA Form 7233-4:
FF KZJXZQZX
232352 KGAITTTD
(FPL-TTT001-IS
-B722/M-SW/C
-KTLH0310
-N0475F340 DCT SZW J41 VUZ HLI1
-KMEM0101
-0)
FP/FPL Comparison Example: FPL with Optional Message Number (Field 3b) & Remarks (RMK)
Domestic FP IAW FAA Form 7233-1:
FF KZJXZQZX
231110 KTULTTTD
TTT1110010 FP TTT002 A320/Q 463 MCO P1225 360
MCO..CTY..SZW..MCB..UIM..TXO..ABQ..PGS.TYSSN1.LAS/0412 :NRP
Equivalent “PRESENT” FPL IAW FAA Form 7233-4: (Prior to ICAO Doc 4444, Amendment 1)
FF KZJXZQZX
231110 KTULTTTD
(FPLTTT/KZJX010-TTT002-IS
-A320/M-SDIGRW/SJ
-KMCO1225
-K0463F360 DCT CTY DCT SZW DCT MCB DCT UIM DCT TXO DCT ABQ DCT PGS
TYSSN1
-KLAS0412
-RMK/NRP)
Equivalent “NEW” FPL IAW FAA Form 7233-4: (After ICAO Doc 4444, Amendment 1)
FF KZJXZQZX
231110 KTULTTTD
(FPLTTT/KZJX010-TTT002-IS
-A320/M-SADE3J2FIGRW/SU2
-KMCO1225
-K0463F360 DCT CTY DCT SZW DCT MCB DCT UIM DCT TXO DCT ABQ DCT PGS
TYSSN1
-KLAS0412
-PBN/D2S1 NAV/GBAS RMK/NRP)
Filing Guidelines for Change (CHG), Delay (DLA) & Cancellation (CNL) Messages
Filing guidelines for CHG, DLA and CNL messages can be found at FAA ICAO Flight Planning Interface Reference Guide(PDF).
Guidelines for receipt of automatic acknowledgement (ACK) and/or rejection (REJ) messages for ICAO compatible messages can be found at Acceptance/Rejection of Domestic ICAO Messages. The link includes examples of ACK, CNL, CHG, DLA and REJ messages, and a chart outlining REJ error messages, their causes and suggested resolutions.
- Addressee – Domestic FPLs should ONLY be addressed to the U.S. Domestic departure ARTCC/FIR. FPLs addressed to subsequent FIRs, including the destination FIR, may be rejected and may cause duplicate flight plans to be stored in ATC systems.
- Item 3, Message Type – An Optional Message Number (Field 3b) can be used to specify a 3-letter NADIN address where the filer would like acknowledgement and/or rejection messages sent. Please see Acceptance/Rejection of Domestic ICAO Messages for detailed instructions.
- Item 7, Aircraft Identification – If the ACID starts with a number, the FPL will be rejected by U.S. systems. If this occurs, contact the Flight Data Unit at the ARTCC to which the flight plan was sent and request assistance. FAA is working to address this issue.
- Item 8, Field 8a, Flight Rules – IAW FAAO 7110.10, Appendix A, ICAO Flight Plans, Item 8(PDF): insert the following:
"I" For Instrument Flight Rules (IFR);
Note: Although U.S. en route facilities may provide limited services (i.e. flight following) to VFR aircraft on a workload permitting basis, they do not provide the full range of services (e.g. weather briefings, Search and Rescue, etc.) provided by the FSS system. Operators are required to file an IFR flight plan for portions of the flight that will be conducted under IFR. It is also strongly recommended that operators file a VFR flight plan directly with an FSS, or other appropriate filing service, for any portion of the flight that will be conducted under VFR (Ref. AIM Section 5-1-4). This will ensure that operators will receive VFR Search and Rescue Protection.
- Item 8, Field 8b, Type of Flight – IAW FAAO 7110.10, insert one of the following:
"S" Scheduled air service; "N" Non-scheduled air transport operation; "G" General aviation; "M" Military; or "X" Other than any of the above categories. - Item 9, Field 9c, Wake Turbulence Category – WTC information is required in an FPL; consult ICAO Document 8643 if you do not know the approved ICAO WTC for your aircraft. The ICAO WTC categories are:
"H" Heavy – Greater than 300,000 lbs. maximum certificated take-off weight "M" Medium – Between 15,000 and 300,000 lbs. maximum certificated take-off weight "L" Light – Less than 15,000 lbs. maximum certificated take-off weight - Fields 13a & 16a, Departure/Destination Aerodrome – File a 4-letter LOCID whenever available, as described in FAA Order (FAAO) 7350.8, Location Identifiers, Section 1.4.1.(PDF)
For airports located within the 48 contiguous United States, convert a 3-letter LOCID by prefixing it with a “K” .
Example: Montgomery County Airpark (GAI) would convert to “KGAI”
If the assigned LOCID contains a digit, or a LOCID has not been assigned for the airport, or the LOCID is unknown:
Insert “ZZZZ” as the departure/destination aerodrome in Fields 13a/16a, as appropriate, and then...
For a departure aerodrome, insert “DEP/” in Field 18, followed by the airport identifier/location
Examples: DEP/T23 DEP/TCC233016
For a destination aerodrome, insert “DEST/” in Field 18, followed by the airport identifier/location
Examples: DEST/T23 DEST/TCC233016
- Item 15, Field 15b, Level – The following non-ICAO altitude formats are permissible in Field 15b of a Domestic IFR FPL. Do not use these formats in an international FPL:
OTP – “OTP/” followed by the requested altitude.
Example: OTP/125
Block Altitude – in the format “dddBddd” where the first “ddd” is the lowest altitude in the block and the second “ddd” is the highest altitude in the block
Example: 210B290
- Item 15, Field 15c, Route – The following non-ICAO route elements are permissible in Field 15c for Domestic FPL. Do not use these formats in an international FPL:
Delay at a fix may be requested using the format “FIX/Dh+mm”
Example: KORRY/D0+25
Coded Route Re-entry Indicator using the format “Route+Rd”
Example: IR107+R1
Note: Do not use these formats in an international FPL.
- Field 18, Other Information
Although the ERAS will accept any Field 18 indicator(s) defined in ICAO Doc 4444, many of these indicators are not required when filing a U.S. Domestic FPL. The following indicators are never required in a domestic FPL. If an operator conducts both domestic and international flights and wishes to file consistently, it is acceptable to include these elements:
- PBN/
- COM/
- DAT/
- SUR/
- DOF/
- EET/
- SEL/
- OPR/
- ORGN/
- PER/
- ALTN/
- RALT/
- TALT/
- RIF/
- CODE/
Notes- When ADS-B is implemented, expect SUR/ and CODE/ to become required elements for domestic FPLs.
General rules for Field 18 are the same as described in the ICAO Flight Planning Interface Reference Guide:
- Insert a -0 if there is no information to file in Field 18
- Use a hyphen only as a field delimiter; never use a hyphen as part of the text in Field 18
- Use an oblique stroke only as part of an indicator; never as part of the text in Field 18
- Use only indicators defined in the PANS-ATM; in a regional supplementary procedures (Doc. 7030) or in an Aeronautical Information Publication (AIP).
The following indicators should be used as necessary in an FPL for a domestic United States flight:
STS/ Include one (or) more of the reasons for special handling listed in ICAO Doc 4444, amendment 1, as described in the ICAO Flight Planning Interface Reference Guide. NAV/ Include RNAV capability information as described in the ICAO Flight Planning Interface Reference Guide. This information is also available in the United States AIP and on the internet at: RNAV Requirements DEP/ File the departure point when ‘ZZZZ’ has been inserted in Field 13a. Follow the instructions in the ICAO Flight Planning Interface Reference Guide. DEST/ File the destination when ‘ZZZZ’ has been inserted in Field 16a. Follow the instructions in the ICAO Flight Planning Interface Reference Guide. IRMK/ Use IRMK/FRC to indicate when a Full Route Clearance must be delivered to the pilot. Any information filed in IRMK/ will be displayed at the departure center only. IRMK/ is a non-standard indicator, documented in the United States AIP. REG/ File the aircraft registration number if flying in RVSM airspace, per the North American (NAM) Regional Supplementary Procedures (Doc. 7030). TYP/ File the aircraft type when ZZZZ is filed in Field 09a. Follow the instructions in the ICAO Flight Planning Interface Reference Guide. DLE/ File a delay at a fix as described in the PANS-ATM. Note: For a domestic flight, it is possible to file a delay directly on a fix in Field 15c as described above.
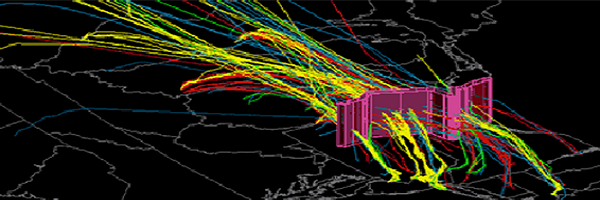
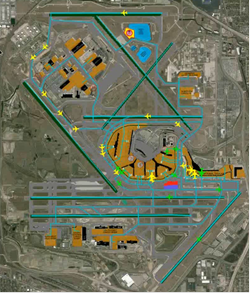
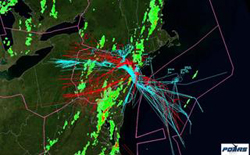
 The Performance Data Analysis and Reporting System (PDARS) is a FAA NAS System designed as an integrated performance measurement tool that facilitates operational analysis to improve the NAS. The system consists of a dedicated network of computers located at FAA sites that use specialized software for collecting detailed air traffic management system data.
 The PDARS system includes 20 domestic Air Route Traffic Control Centers (ARTCC's), 28 Terminal Radar Approach Control (TRACON) facilities, 27 ASDE-X equipped airports. PDARS is also used at FAA Service Area Offices, the Air Traffic Control System Command Center, the Mike Monroney Aeronautical Center, and FAA Headquarters.

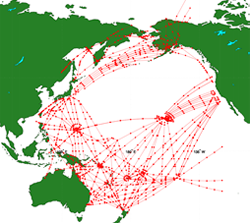
 ASPM constitutes the most comprehensive flight level database used for performance analysis within FAA.It contains a host of key event times including actual, scheduled as well as the airline reported gate and runway times. It also synthesizes key times from the traffic flow management system and links flight level information from the National Traffic Management Log (NTML).
 OPSNET provides the official source for traffic operations and reportable delay. Reportable delay includes the causal information such as the constrained facility, the reason for delay (weather, equipment, runways etc.) and the traffic management initiative employed in delaying the aircraft.
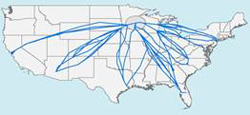
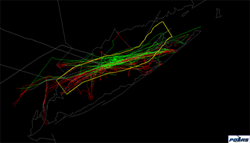
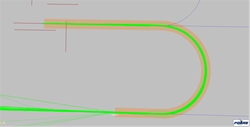
 Flight Trajectory database is used for performance measures that assess if flights are obtaining more efficient trajectories or if problem areas are emerging. The flight level data compares actual trajectories to both direct flight or a best achieved flight. In response to congressional request, the flight level data also tracks continuous ascent and continuous descent operations.
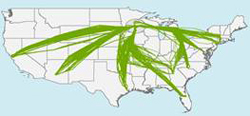
 Fuel Burn database contains per flight fuel consumption data for select city pairs. The data is provided on a voluntary basis by airlines and air cargo operators in response to a congressional requirement, and is used to analyze the operational performance of the NAS and the benefits of operational improvements.