Confidence Metrics
Background
For operational use, the NextGen Weather Processor (NWP) must provide deterministic "radar-forward" storm predictions out to 8 hours and convey confidence in the predictions so strategic planners know whether to take action or not.
NWP confidence metrics are specifically designed to convey uncertainty in the predicted airspace constraints due to weather, not uncertainty in the weather forecast itself. The forecast is communicated via the display of the TCF baseline planning guidance overlaid upon the NextGen Weather predictive products on the Aviation Weather Display. Strategic planners are often concerned about the impact of weather on busy regions of airspace containing heavily used, closely spaced jet routes. To control en route flow through such regions, an airspace flow program for a pre-defined Flow Constrained Area (FCA) can be implemented, where flow rates are constrained hour by hour through the FCA before and during the weather impact. Predicting weather constraints on busy terminal airspace is also of great concern to planners. En route and terminal confidence metrics are required for strategic traffic flow management.
Machine Learning

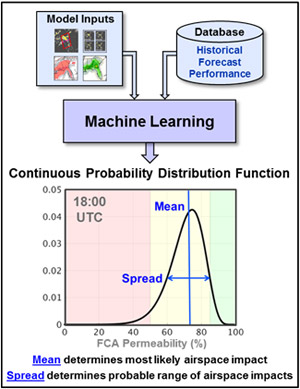
The machine learning process used to compute the NWP confidence metrics is illustrated in the figure. The box labeled "Machine Learning" in the center of the diagram has two main input sources for each forecast time. Model inputs, shown in the upper left, include various forecast features from the NWP predictive products plus two National Oceanic and Atmospheric Administration models: High Resolution Rapid Refresh model (HRRR), with multiple hourly runs combined to form a time-lagged ensemble; and Localized Aviation Model Output Statistics (MOS) Program (LAMP). The historical forecast performance statistics, shown as a database in the upper right, provide historical information for all the model inputs and are used to train the algorithm that estimates the probability of weather-related airspace constraint at each forecast time.
The output from machine learning takes the form of a continuous probability distribution function at each forecast time. An example of the distribution for 18:00 UTC is shown at the bottom of the figure. The mean of the distribution indicates the most likely airspace constraint, quantified in terms of the permeability of the airspace within the FCA. (Airspace is permeable if aircraft can flow through it. Unconstrained airspace has 100 percent permeability and severely restricted airspace has 0 percent permeability.) The spread of the distribution indicates the probable range of airspace constraints. A wide distribution implies broad uncertainty in the estimate, while a narrow, sharply peaked distribution implies a high degree of certainty.
Confidence Metrics
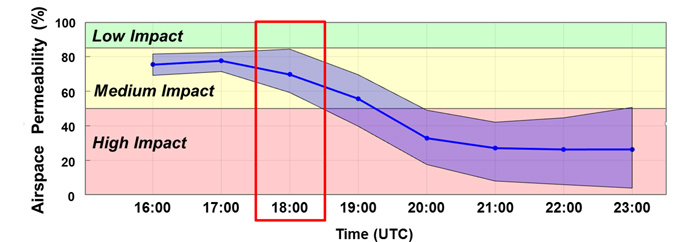
The resulting NWP confidence metrics are shown in the 8-hour timeline figure. The display indicates predicted FCA weather impacts via airspace permeability, ranging from 0 to 100 percent. The blue line is a plot of the distribution mean at each forecast time and represents the most likely values of FCA permeability at each hour out to 8 hours into the future. The purple shading above and below the blue line delineates the range of probable impacts, derived from the distribution spread at each forecast time. The red box around the data at 1800 UTC shows the portion of the confidence timeline chart that corresponds with the continuous probability distribution function example shown in the machine learning figure. Confidence metrics are mapped against low-medium-high levels of weather impact shown as green-yellow-red background shading.

Display Concept
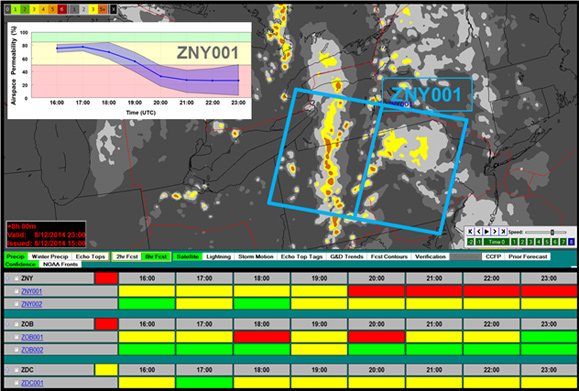
A display concept for NWP confidence metrics is illustrated in the figure below, where the display home is pre-set to New York and the NWP precipitation at 8 hours is shown in the top panel. A notional FCA named ZNY001, designed to capture the major east-west flows through Pennsylvania into New York, is shown overlaid as a light blue rectangle oriented roughly east-west. The bottom panel shows the estimated weather impact at each hour out to 8 hours into the future, for a set of five pre-defined FCAs that control major flows into New York. A green-yellow-red color scheme is used to convey low-medium-high impacts. A link in the first column of each row brings up the full 8-hour confidence timeline plot described in the previous section, and shown again here in the upper left portion of the figure.

Summary
NWP confidence metrics provide a translation of "radar-forward" weather predictions, which show the future storm pattern, storm intensity and vertical extent, into predicted operational weather constraints on the National Airspace System. They allow strategic traffic flow managers to quickly glean the severity and duration of weather constraints over the next 8 hours. With a display concept including confidence metrics and evidence of a predicted weather constraint — perhaps the motivation for a restrictive airspace flow program — can be viewed by all stakeholders, thus enhancing shared situational awareness. Every stakeholder can make informed decisions based on the most probable outcomes, without suffering from weather information overload or from limited single-source guidance.
