
2-8 Hour Predictive Products
Baseline: Convective Forecast Planning
The forecast used today by traffic management stakeholders is the Traffic Flow Management (TFM) Convective Forecast or TCF. The TCF consists of three contour maps created every 2 hours showing high-confidence regions of thunderstorms at 4, 6, and 8 hours into the future. The TCF indicates expected storm coverage via blue polygons filled a with light hatch pattern for sparse (25-39 percent) coverage areas and dense striped pattern for medium (40-74 percent) coverage areas. Solid (75-100 percent) line coverage is indicated as thick purple line. The TCF contours do not resemble typical radar thunderstorm depictions. Instead, they surround likely regions where convective weather with the indicated areal coverage is expected.
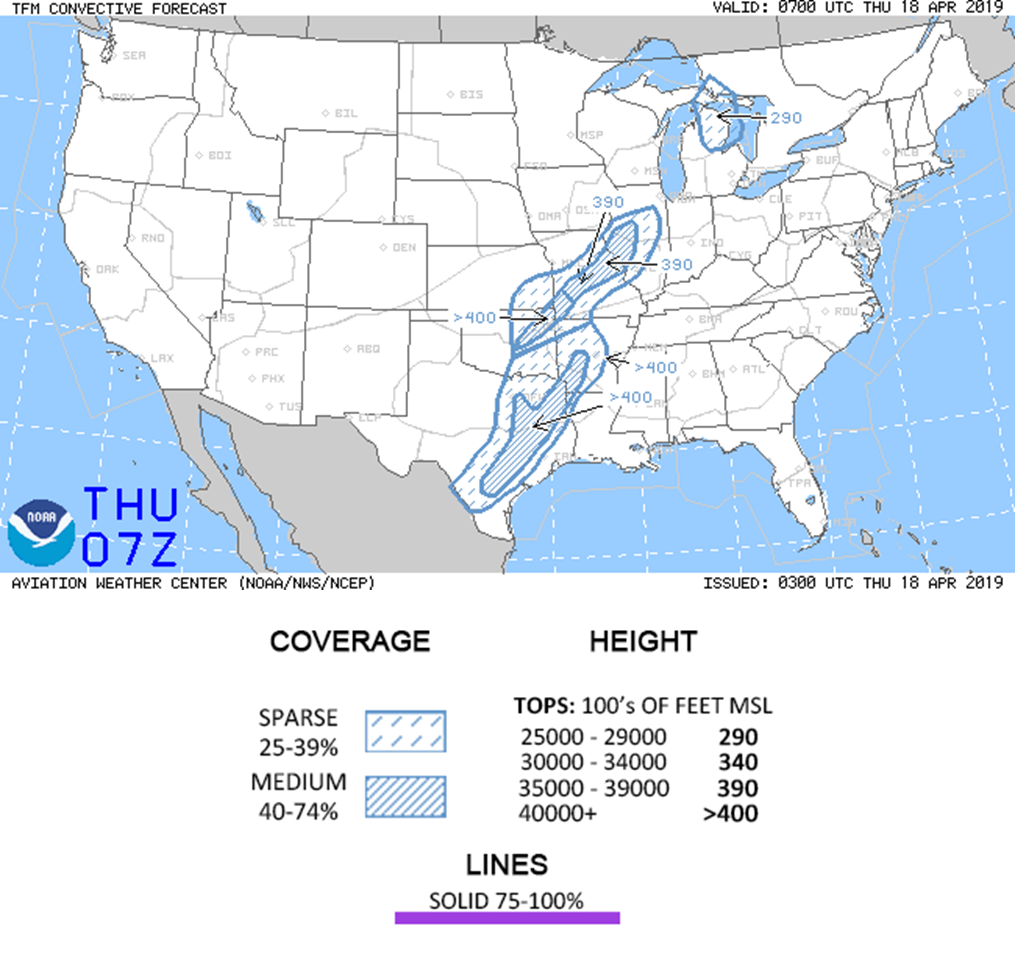
In the image, an example of a 4-hour TCF issued at 0300 UTC and valid at 0700 UTC on April 18, 2019 shows two long oval regions of sparse coverage stretching from south Texas to Arkansas, and from Oklahoma to Illinois, respectively. Within each of these large regions are similarly oriented, slightly smaller regions of medium coverage. The northern of these over Missouri indicates storm tops of 35,000-39,000 feet (labeled '390' on map), while the southern regions over Oklahoma and Texas indicate storm tops greater than 40,000 feet. A small sparse coverage region with tops of 25,000-29,000 ('290') feet is shown in northern Michigan.
NextGen Weather Predictive Products
In contrast to TCF, the NextGen Weather Processor (NWP) predicts "radar-forward" storms from the current time out to 8 hours into the future. "Radar-forward" means that the future storm pattern, storm intensity and vertical extent, as well as new storm growth and decay, are portrayed in a similar format to their presentation on current radar maps. FAA en route and terminal users are accustomed to viewing weather radar mosaics to indicate thunderstorm flight hazards, and they are familiar with interpreting storm-imposed constraints on their airspace via their radar displays.
To illustrate the NextGen "radar-forward" predictions, the NWP precipitation product issued at 1300 UTC on September 11, 2013, was selected. In the figure below, the precipitation product is shown on the left, and the "truth" — the actual radar map that was eventually measured for each valid time — is shown on the right. The animation loops from 1 to 8 hours into the future in 1-hour steps, revealing the evolution of storms over the northeast, including Ohio, West Virginia, Pennsylvania and New York. Notice how the NWP product conveys the overall storm pattern, including multiple parallel lines of storms with gaps in between, the intensity of the storms, and the timing of storm growth in the region. The NWP product strongly resembles at every time step the actual storms that eventually occurred.
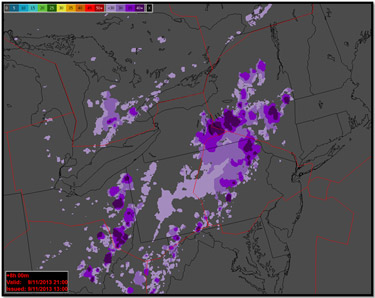
NWP also provides a "radar-forward" echo tops prediction that indicates the vertical extent of storms. An example of the 8-hour echo tops product for the same case is shown. As with the precipitation product, the overall pattern of storms is conveyed in high resolution. The storm tops in central and eastern New York state, northeastern Pennsylvania, and southeastern Ohio are predicted to be over 40,000 feet tall, blocking jet routes and reducing capacity in those areas. (An animation for this same day displaying flight paths around the weather-impacted airspace is shown in the frequently asked question "What happens when en route flights encounter thunderstorms?".)
NWP predicts up to 5 minutes apart to 2 hours, and up to 15 minutes apart to 8 hours. The format for the 2-8 hour strategic predictions is identical to the 0-2 hour predictions, providing a seamless capability for strategic and tactical impact assessment. The National Oceanic and Atmospheric Administration (NOAA) operational High Resolution Rapid Refresh numerical model contributes most heavily to the NWP results, while other NOAA models provide additional utility within the greater NWP domains and contribute to forecast confidence metrics.
NWP's predictive products, with their associated translation products and confidence metrics, pave the way for the generation of quantitative, objective capacity impact predictions needed to support collaborative strategic traffic flow management.