Translation Products
Effective strategic management of traffic flows during convective weather events requires a system that can translate convective weather information into anticipated air traffic operational impact. Predictions of convective weather impacts enable proactive traffic flow management, leading to an increase in the effective use of available airspace and a reduction in overall air traffic delay.
Predicting Air Traffic Impact due to Convective Weather
Convective weather delays occur because thunderstorms reduce the capacity of air traffic resources, for example jet routes. Capacity is reduced because it is harder for the air traffic controller, who is controlling the thunderstorm-impacted resource, to keep aircraft safely separated. One of the challenges is that the controller must predict pilot responses to thunderstorms. If a pilot asks to deviate from the planned route to avoid a thunderstorm, the controller must guide the deviation while keeping the aircraft safely separated from other nearby aircraft. Effectively predicting delays means first accurately predicting pilot behaviors in convective weather.
Convective Weather Avoidance Fields

To solve this problem, NASA developed the Convective Weather Avoidance Model (CWAM), a first-of-its-kind model that estimates the probability a pilot will change his or her route to avoid convective weather. CWAM provides a probabilistic measure of the response of pilots to convective weather based on correlating detailed weather observations with trajectories of aircraft that either penetrated or deviated to avoid areas of convective weather.
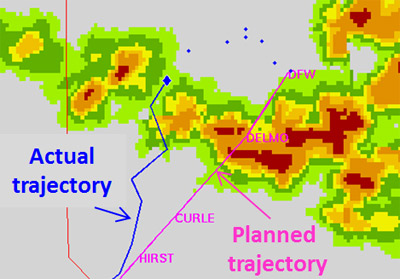
An example of a pilot deviation due to convective weather is shown in the image. The pink line is the planned trajectory with labeled points along the path to the Dallas/Fort Worth airport (DFW). The blue line is the actual trajectory flown by the aircraft, represented as a blue diamond. Several blue points ahead of the aircraft indicate future points along the rerouted flight path into DFW. Notice how the planned trajectory intersects heavy weather, as indicated by the orange and red radar returns, and the actual trajectory almost entirely avoids the weather.
Until the advent of the NextGen Weather Processor (NWP), no source had sufficiently precise and quantitative weather characteristics needed to model pilot behavior. CWAM requires as input NWP’s high resolution, deterministic radar-forward predictions of precipitation and echo tops. Broadly defined probabilistic weather forecasts like Traffic Flow Management (TFM) Convective Forecast do not offer the kind of detailed weather characteristics needed to model pilot decisions.
The output of CWAM is the convective weather avoidance field (CWAF), which requires as input the aircraft flight altitude, and the NWP precipitation and echo tops products. CWAF indicates the probability that a pilot will deviate at a specific position in 3-D plus time. Predictions of en route and terminal airspace constraints due to weather, based on CWAF estimates, yield more reliable planning information for airlines and their passengers.
Convective Weather Avoidance Polygons

To enable predictions of the most likely weather-avoiding trajectories through areas flagged by CWAF, NASA further developed convective weather avoidance polygons (CWAP). Construction of the polygons relies heavily on the echo tops field at flight altitude most commonly associated with cloud boundaries that pilots will avoid. The CWAP identify fly/no-fly boundaries of convective storms that impact air traffic operations.
With robust polygons defined, preferred weather-avoiding trajectories can be automatically generated. Knowing these trajectories in advance can help reduce the workload required to plan and coordinate deviations during weather impacts.
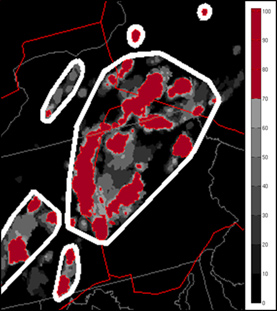
An example of the CWAF and CWAP for thunderstorms over New York and Pennsylvania is shown in the preceding graphic. CWAF probabilities less than 70 percent are shown in gray, while probabilities greater than 70 percent are shown in red. Also illustrated are six polygons ranging in size from small to large, shown as thick white contours surrounding CWAF regions. While the largest of these CWAP enclose high and low probabilities of pilot deviation, the outer polygon delineates the entire region through which pilots are unlikely to fly. Pilot trajectories have been shown to remain outside of the CWAP enclosed regions.
NWP's predictive products, along with the associated translation products described here, are used in building confidence metrics that support the operational decision making required of strategic traffic flow managers.
