FAQ: Weather Delay
- What is the largest cause of delay in the National Airspace System?
- Which airports have the worst weather-related delay?
- What type of weather causes the most delay?
- What happens when en route flights encounter thunderstorms?
- What happens if thunderstorms prevent landing at an airport?
- How far in advance do traffic flow planners need weather predictions?
- What is NextGen Weather providing to help reduce weather delay?
What is the largest cause of delay in the National Airspace System?
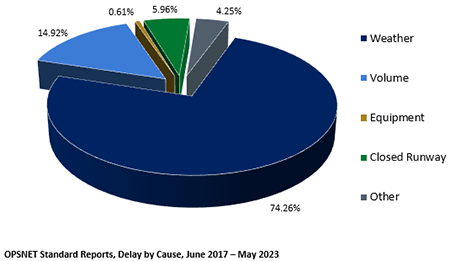
The largest cause of air traffic delay in the National Airspace System is weather. The pie chart shows that weather caused 74.26 percent of system impacting delays of greater than 15 minutes over the six years from June 2017 to May 2023, as recorded in the OPSNET standard "delay by cause" reports. While weather is the most significant cause of delay because of too much demand for the impacted resources, volume alone, caused by too much demand even with unconstrained resource capacity, also accounts for 14.92 percent of delays. Equipment failure creates 0.61 percent, runway unavailability 5.96 percent, and "other" factors the remaining 4.25 percent of delay. These delay statistics include air carriers, air taxis, general aviation, and military classes of aircraft.
Which airports have the worst weather-related delay?
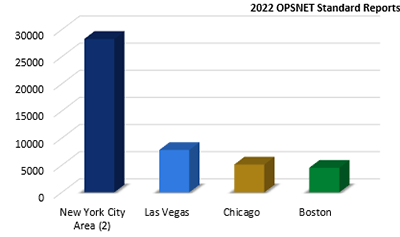
The bar chart shows that the combined delay at two of the biggest airports in the New York City area (Newark and LaGuardia) is the highest in the country, with almost 30,000 significant delays of more than 15 minutes in 2022. The other top delay airports are Las Vegas (nearly 8,000 delays in 2022), Chicago (over 5,000), and Boston (nearly 5,000).
These five airports have the worst weather-related delay experience. However, weather alone does not necessarily lead to massive delays.
If an airport has excess capacity, many delayed planes can be shifted to non-weather periods without overloading the system. However, airports with the most weather delays also tend to operate close to capacity for large parts of the day. System-impacting weather, combined with excess demand, means that delayed flights may have to wait hours to land or depart.
What type of weather causes the most delay?
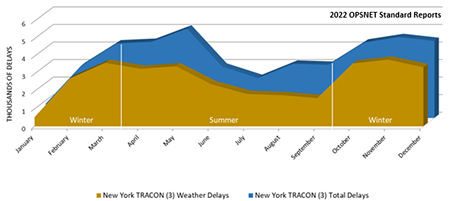
The type of weather causing air traffic delays differs over the year and also depends on the country's geographical area.
For example, the graph shows combined total delays (blue) and weather delays (dark yellow) by month in 2022 at Newark, LaGuardia, and Kennedy airports. Weather and total delays exhibit varying peaks, with weather delays peaking in early winter (nearly 3,800) and total delays peaking at almost 5,200 in May. Overall, weather delays can vary yearly and month to month. For 2022, weather delays are most prevalent in winter, with the highest values in November, March, and October (ranging from about 3,500-3,800).
What happens when en route flights encounter thunderstorms?
Jet aircraft can safely fly over thunderstorms only if their flight altitude is well above the turbulent cloud tops. The most intense and turbulent storms are often the tallest, so en-route flights always seek to go around them.
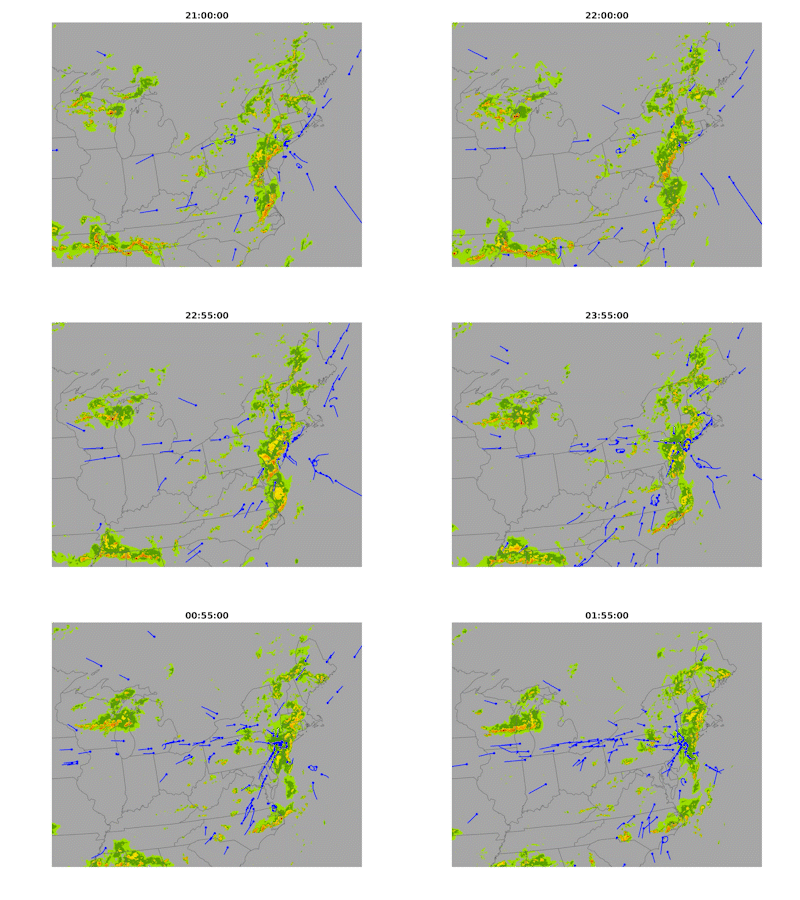
If a busy jet route becomes blocked by intense thunderstorms, traffic will reroute into the neighboring airspace, which can become overcrowded if the flow is not managed (see animation). In these cases, a planning team consisting of FAA personnel at the Air Traffic Control System Command Center coordinates with the centers, select terminals, airlines, NAVCANADA, general aviation organizations, and the military regarding several options, some of which are discussed below.
In case of a large-scale weather impact, a severe weather avoidance plan may be implemented to relocate demand to another part of the country. The planning team's strategic placement of airspace flow programs with reduced hourly flow rates allows airlines to prioritize and plan which of their scheduled flights to route through the restricted airspace. Ground delay programs are also used to temporarily hold aircraft at their departure airports to reduce the number of flights going into an impacted area.
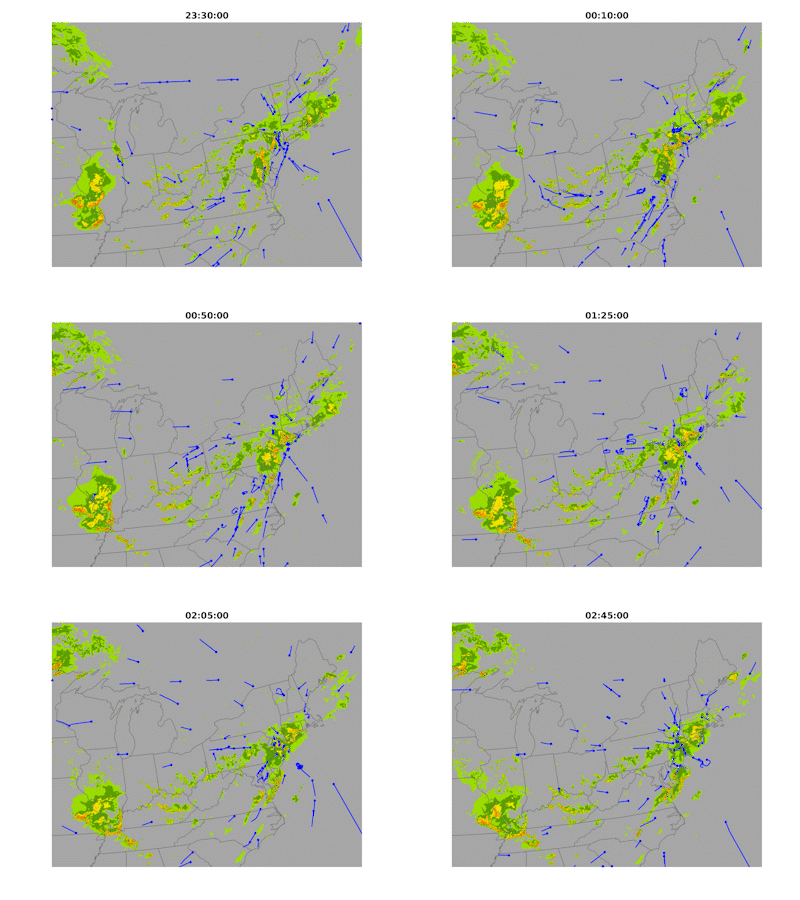
As an example, on July 17, 2019, a low pressure developed to the southwest and moved over the greater metropolitan area of New York as a cold front approached from the north. The remnants of Tropical Storm Barry bring most shower and thunderstorm activity.
As seen in the animation, few flights could get through the weather-impacted airspace, and many of them were routed around active regions to avoid the weather. Due to longer reroute times, flights bound for New York couldn’t arrive on time.
One hundred-eight aircraft diverted to alternate airports in the northeast region and 57 aircraft were assigned to a holding pattern. There were 565 departure cancellations, 535 arrival cancellations, and an accompanying 784 total delays.
What happens if thunderstorms prevent landing at an airport?
As the arriving aircraft approaches its destination airport, the pilot will usually be asked to slow down or enter a holding pattern until the thunderstorms in and around the airport have cleared. As more planes arrive and holding continues, over-crowded airspace and running out of fuel can become serious issues. Landing these arrivals safely becomes the top priority.
Controllers can opt to use more of the available terminal routes for arrivals and fewer for departures. With fewer planes departing, terminal gates remain occupied, and airport gridlock can occur. Cases where passengers were stranded for excessive periods led the Department of Transportation to pass a rule prohibiting airlines from leaving planes parked for more than 3 hours without allowing passengers to disembark.
If thunderstorms persist, holding aircraft will divert to alternate airports, wait out the bad weather, refuel, and fly again later to the original destination. Diversions are undesirable because of the magnitude of passenger delay and cost to airlines.
An example of thunderstorms temporarily preventing airport landing occurred on August 7, 2019, as growing thunderstorms delayed several flights in the northeast region.
The animation shows that as storms approached the airports, aircraft were forced to hold around the airports until the weather cleared. In total, 171 airborne flights were held. Two hundred seventeen aircraft diverted to alternate airports.
How far in advance do traffic flow planners need weather predictions?
Unforeseen weather impacts on en route and terminal airspace can lead to long delays and ultimately be costly to the airlines and the traveling public. If weather impacts are either short-lived or local, they can be mitigated by effectively using available airspace. All airborne and scheduled flights can be handled with only minor reroutes.
However, as the weather impacts become longer lived, affect larger regions of the country, or both, management of the demand must be planned strategically. In weather events requiring moderate to aggressive management, many scheduled flights will require new flight plans that do not intersect the weather-impacted areas.
Some flights through the impacted airspace may originate at nearby airports, with only short intervals from departure to arrival. In contrast, other flights may cross the country and be airborne for hours. A severe long-lived weather impact will require managing short- and long-haul flights to effectively control the demand.
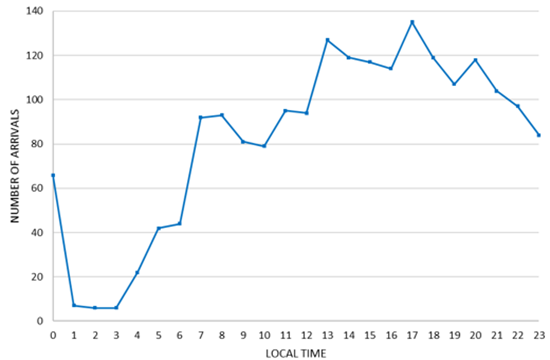
The line chart combines all arrivals into three New York airports – Newark, LaGuardia, and Kennedy – through an entire day with no weather delays.
Strategic traffic flow managers must plan hours in advance to influence long-haul flights. Suppose the time needed for pre-departure planning and filing amended flight plans is added to the airborne time intervals. In that case, predictions of convective weather impacts on airspace capacity are needed 4-8 hours in advance to influence long-haul flights and 2-6 hours in advance to influence shorter flights.
What is NextGen Weather providing to help reduce weather delay?
NextGen Weather provides aviation weather products that support tactical and strategic management of air traffic during weather events, helping minimize passenger delays and improve aviation safety.
Tactical Traffic Flow Management
Managing traffic tactically uses available airspace resources to handle the normal traffic demand and requires accurate depictions of weather impacts in the 0-2 hour time frame. Traffic flow managers can take different steps, such as locally rerouting traffic around the weather, directing en route traffic to a weather-free arrival path near the destination airport, and delaying arrivals by placing them in holding stacks until the weather clears. Many of NextGen Weather's improved products support tactical traffic flow management.
Strategic Traffic Flow Management
To support strategic traffic flow management, operational planners require precise, high-confidence predictions of weather impacts on airspace capacity out to 8 hours to plan strategies such as traffic flow re-routes, flow rate restrictions, or both. They also need the shared situational awareness required for collaborative decision-making on strategic time scales. NextGen Weather provides the foundation for developing critically needed traffic flow management tools.
Detailed information is provided in the support for strategic traffic flow management section.
Aviation Safety
Although improved efficiency of the National Airspace System (NAS) is NextGen Weather's primary benefit, the program also enhances aviation safety in several ways. The NextGen Weather Processor (NWP) provides aviation weather products with improved coverage, faster product update rates, and fewer artifacts. For example, the NWP growth trend product updates every 25 seconds and indicates where thunderstorms are actively growing and airspace to avoid.
Common Support Services – Weather (CSS-Wx) and the NWP Aviation Weather Display (AWD) enable access throughout the NAS to NWP products such as lightning and tornado detections. Broad and timely access to these products enhances awareness of ongoing severe safety hazards. Another safety improvement CSS-Wx and AWD provides is the display of NOAA aviation-oriented icing and turbulence products, providing users with an indication of where and when in-flight icing and/or turbulence may occur.
